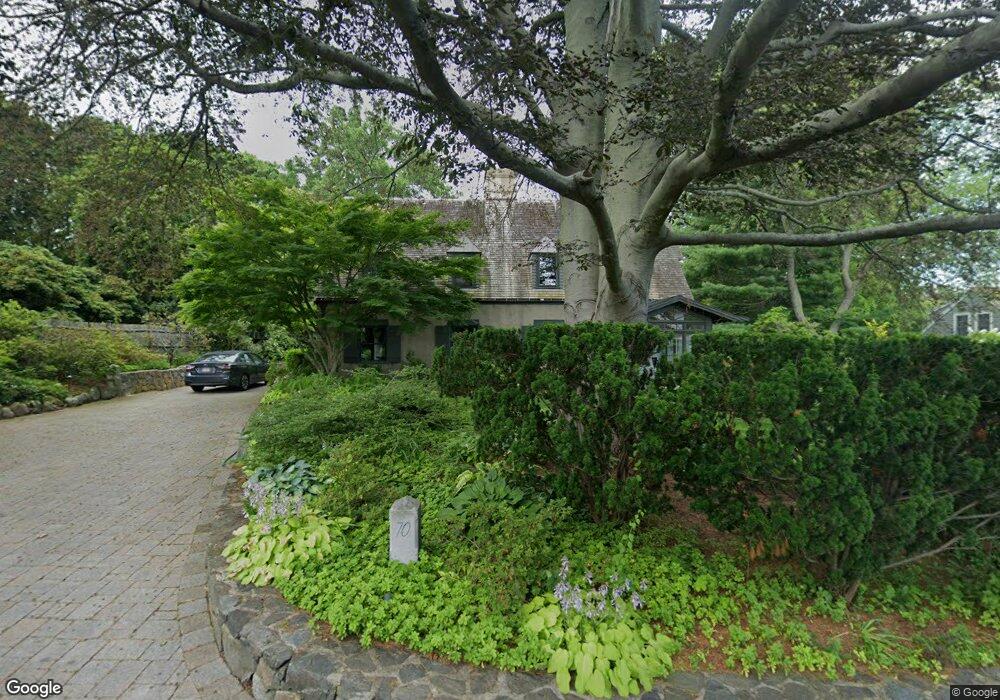
70 Seaview Ave Marblehead, MA 01945
Estimated Value: $1,265,000 - $1,591,000
4
Beds
5
Baths
3,835
Sq Ft
$359/Sq Ft
Est. Value
About This Home
This home is located at 70 Seaview Ave, Marblehead, MA 01945 and is currently estimated at $1,376,461, approximately $358 per square foot. 70 Seaview Ave is a home located in Essex County with nearby schools including Marblehead High School, Devereux School, and Tower School.
Ownership History
Date
Name
Owned For
Owner Type
Purchase Details
Closed on
Oct 31, 2023
Sold by
Santos John C
Bought by
John C Santos 2023 Ret and Santos
Current Estimated Value
Purchase Details
Closed on
Nov 15, 2022
Sold by
Seventy Seaview Avenue Nt and Martinez-Santos
Bought by
Santos John C
Home Financials for this Owner
Home Financials are based on the most recent Mortgage that was taken out on this home.
Original Mortgage
$1,100,000
Interest Rate
6.95%
Mortgage Type
Stand Alone Refi Refinance Of Original Loan
Purchase Details
Closed on
Jun 6, 2017
Sold by
Santos John C
Bought by
Seventy Seaview Avenue and Seventy Santos
Create a Home Valuation Report for This Property
The Home Valuation Report is an in-depth analysis detailing your home's value as well as a comparison with similar homes in the area
Home Values in the Area
Average Home Value in this Area
Purchase History
| Date | Buyer | Sale Price | Title Company |
|---|---|---|---|
| John C Santos 2023 Ret | -- | None Available | |
| John C Santos 2023 Ret | -- | None Available | |
| John C Santos 2023 Ret | -- | None Available | |
| Santos John C | -- | None Available | |
| Santos John C | -- | None Available | |
| Santos John C | -- | None Available | |
| Seventy Seaview Avenue | -- | -- | |
| Seventy Seaview Avenue | -- | -- |
Source: Public Records
Mortgage History
| Date | Status | Borrower | Loan Amount |
|---|---|---|---|
| Previous Owner | Santos John C | $1,100,000 | |
| Previous Owner | Seventy Seaview Avenue | $150,000 |
Source: Public Records
Tax History Compared to Growth
Tax History
| Year | Tax Paid | Tax Assessment Tax Assessment Total Assessment is a certain percentage of the fair market value that is determined by local assessors to be the total taxable value of land and additions on the property. | Land | Improvement |
|---|---|---|---|---|
| 2025 | $11,419 | $1,261,800 | $703,900 | $557,900 |
| 2024 | $12,915 | $1,441,400 | $894,600 | $546,800 |
| 2023 | $11,038 | $1,103,800 | $652,600 | $451,200 |
| 2022 | $10,299 | $979,000 | $542,600 | $436,400 |
| 2021 | $9,857 | $946,000 | $513,300 | $432,700 |
| 2020 | $9,532 | $917,400 | $528,000 | $389,400 |
| 2019 | $9,380 | $873,400 | $484,000 | $389,400 |
| 2018 | $9,463 | $858,700 | $469,300 | $389,400 |
| 2017 | $8,970 | $814,700 | $425,300 | $389,400 |
| 2016 | $8,252 | $743,400 | $366,600 | $376,800 |
| 2015 | $7,912 | $714,100 | $337,300 | $376,800 |
| 2014 | $7,445 | $671,300 | $308,000 | $363,300 |
Source: Public Records
Map
Nearby Homes
- 179 Beach Bluff Ave
- 48 Bellevue Rd
- 212 Humphrey St Unit 205
- 25 Manton Rd
- 201 Humphrey St Unit 2
- 5 Elmwood Rd
- 37 Stanley Rd
- 19 Elmwood Rd
- 25 Tedesco St
- 24 Orchard Cir
- 9 Tedesco Pond Place Unit 9
- 83 Lafayette St
- 2 Martin St
- 3 Oak St
- 34 Lafayette St
- 1006 Paradise Rd Unit 3R
- 35 Alden Rd
- 30 Amherst Rd
- 1004 Paradise Rd Unit PHJ
- 6 Loring Hills Ave Unit D3
- 64 Seaview Ave
- 74 Seaview Ave
- 25 Preston Beach Rd
- 67 Seaview Ave
- 28 Preston Beach Rd
- 69 Seaview Ave
- 63 Seaview Ave
- 60 Seaview Ave
- 23 Preston Beach Rd
- 26 Preston Beach Rd
- 61 Seaview Ave
- 61 Seaview Ave Unit 1
- 59R Pilgrim Rd
- 132 Beach Bluff Ave
- 24 Preston Beach Rd
- 57 Pilgrim Rd
- 58 Seaview Ave
- 61 Pilgrim Rd
- 75 Seaview Ave
- 120 Bellevue Rd