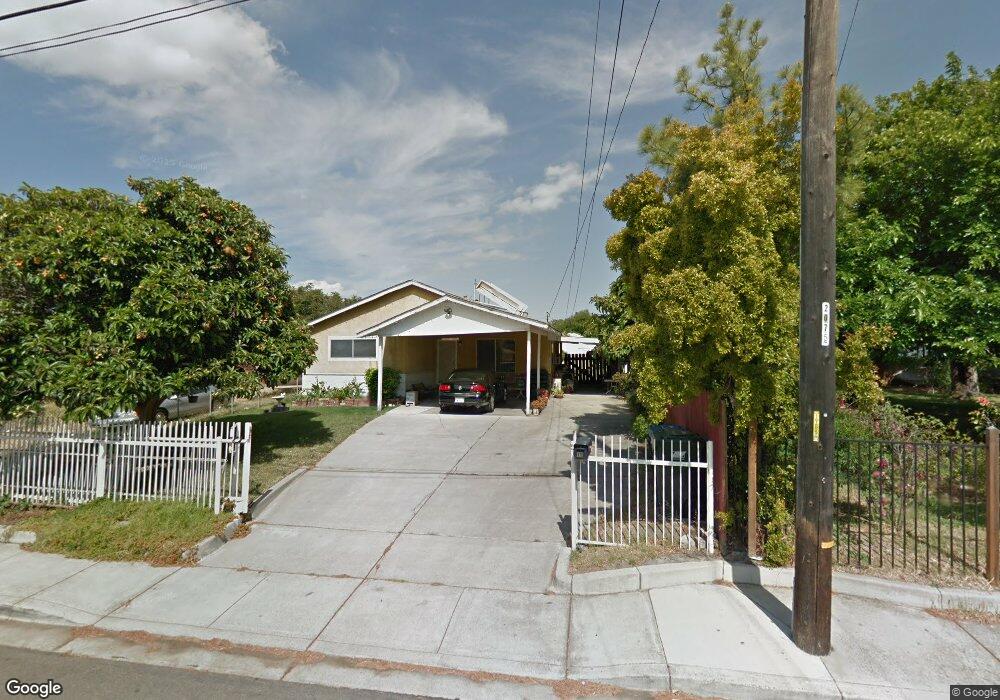
70 Solano Ave Bay Point, CA 94565
Anuta Park NeighborhoodEstimated Value: $437,000 - $448,525
3
Beds
1
Bath
1,076
Sq Ft
$410/Sq Ft
Est. Value
About This Home
This home is located at 70 Solano Ave, Bay Point, CA 94565 and is currently estimated at $441,508, approximately $410 per square foot. 70 Solano Ave is a home located in Contra Costa County with nearby schools including Bel Air Elementary School, Riverview Middle School, and Mt. Diablo High School.
Ownership History
Date
Name
Owned For
Owner Type
Purchase Details
Closed on
Jul 17, 2017
Sold by
Dusich Henry
Bought by
Dusich Paige M
Current Estimated Value
Purchase Details
Closed on
Aug 5, 2015
Sold by
Wells Fargo Bank Na
Bought by
Dusich Henry
Purchase Details
Closed on
Jul 17, 2015
Sold by
Dusich Judith
Bought by
Dusich Henry
Purchase Details
Closed on
Mar 9, 2015
Sold by
Tucker Freddie M and Tucker William D
Bought by
Wells Fargo Bank Na
Purchase Details
Closed on
Oct 13, 2006
Sold by
Tucker Freddie M and Tucker Freddie Mae
Bought by
Tucker William D and Tucker Freddie M
Home Financials for this Owner
Home Financials are based on the most recent Mortgage that was taken out on this home.
Original Mortgage
$350,000
Interest Rate
8%
Mortgage Type
Negative Amortization
Purchase Details
Closed on
Dec 17, 2004
Sold by
Tucker William D and Tucker Freddie Mae
Bought by
Tucker William D and Tucker Freddie Mae
Home Financials for this Owner
Home Financials are based on the most recent Mortgage that was taken out on this home.
Original Mortgage
$274,500
Interest Rate
7.2%
Mortgage Type
Stand Alone Refi Refinance Of Original Loan
Create a Home Valuation Report for This Property
The Home Valuation Report is an in-depth analysis detailing your home's value as well as a comparison with similar homes in the area
Home Values in the Area
Average Home Value in this Area
Purchase History
| Date | Buyer | Sale Price | Title Company |
|---|---|---|---|
| Dusich Paige M | -- | None Available | |
| Dusich Henry | $184,500 | Placer Title Company | |
| Dusich Henry | -- | Placer Title Company | |
| Wells Fargo Bank Na | $234,000 | Premium Title | |
| Tucker William D | -- | Alliance Title Company | |
| Tucker William D | -- | Chicago Title |
Source: Public Records
Mortgage History
| Date | Status | Borrower | Loan Amount |
|---|---|---|---|
| Previous Owner | Tucker William D | $350,000 | |
| Previous Owner | Tucker William D | $274,500 |
Source: Public Records
Tax History
| Year | Tax Paid | Tax Assessment Tax Assessment Total Assessment is a certain percentage of the fair market value that is determined by local assessors to be the total taxable value of land and additions on the property. | Land | Improvement |
|---|---|---|---|---|
| 2025 | $3,298 | $218,049 | $106,539 | $111,510 |
| 2024 | $3,119 | $213,774 | $104,450 | $109,324 |
| 2023 | $3,119 | $209,583 | $102,402 | $107,181 |
| 2022 | $3,099 | $205,475 | $100,395 | $105,080 |
| 2021 | $3,024 | $201,447 | $98,427 | $103,020 |
| 2019 | $2,940 | $195,473 | $95,508 | $99,965 |
| 2018 | $2,843 | $191,641 | $93,636 | $98,005 |
| 2017 | $2,754 | $187,884 | $91,800 | $96,084 |
| 2016 | $2,671 | $184,200 | $90,000 | $94,200 |
| 2015 | $830 | $26,097 | $5,359 | $20,738 |
| 2014 | $800 | $25,587 | $5,255 | $20,332 |
Source: Public Records
Map
Nearby Homes
- 64 N Bella Monte Ave
- 201 Solano Ave
- 205 Solano Ave
- 64 S Bella Monte Ave
- 1998 Calaveras Dr
- 1988 Calaveras Dr
- 179 Crivello Ave
- 79 Bella Vista Ave
- 2169 Rain Drop Cir
- 2867 Willow Pass Rd
- 0 Mountain View Ave
- 24 Mountain View Ave
- 68 - 76 Bayview Ave
- 1123 Chadwick Cir
- 27 Loftus Rd
- 641 Chadwick Ln
- 8 Lancaster Cir Unit 224
- 191 Maureen Cir
- 3 Lancaster Cir Unit 211
- 7 Lancaster Cir Unit 137
- 74 Solano Ave
- 80 Solano Ave
- 75 Poinsettia Ave
- 81 Poinsettia Ave
- 69 Poinsettia Ave
- 87 Poinsettia Ave
- 83 Solano Ave Unit 14
- 83 Solano Ave Unit 6
- 83 Solano Ave
- 63 Solano Ave
- 46 Solano Ave
- 93 Poinsettia Ave
- 94 Solano Ave
- 61 Solano Ave
- 40 Solano Ave
- 105 Poinsettia Ave
- 447 Pullman Ave
- 112 Solano Ave
- 45 Poinsettia Ave
- 101 Solano Ave
Your Personal Tour Guide
Ask me questions while you tour the home.