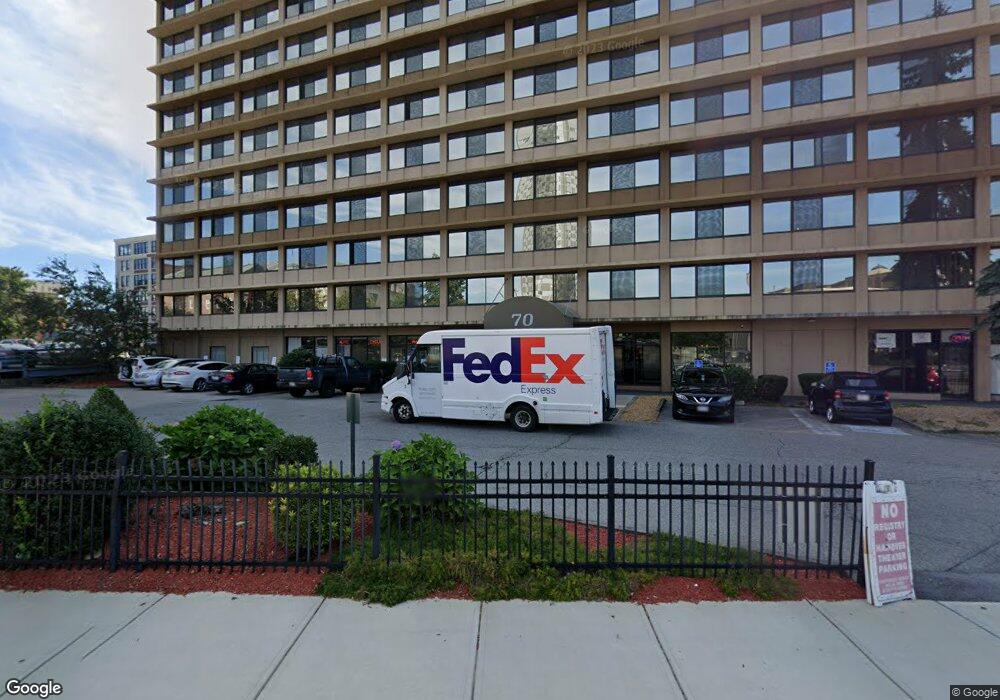
Madison Tower Condominimums 70 Southbridge St Unit 509 Worcester, MA 01608
Downtown Worcester NeighborhoodEstimated Value: $164,000 - $178,000
1
Bed
1
Bath
445
Sq Ft
$388/Sq Ft
Est. Value
About This Home
This home is located at 70 Southbridge St Unit 509, Worcester, MA 01608 and is currently estimated at $172,841, approximately $388 per square foot. 70 Southbridge St Unit 509 is a home located in Worcester County with nearby schools including Jacob Hiatt Magnet School, Chandler Elementary Community School, and Chandler Magnet.
Ownership History
Date
Name
Owned For
Owner Type
Purchase Details
Closed on
Feb 23, 2018
Sold by
Moschella Edward E
Bought by
Fleury Orlando
Current Estimated Value
Home Financials for this Owner
Home Financials are based on the most recent Mortgage that was taken out on this home.
Original Mortgage
$36,000
Outstanding Balance
$20,108
Interest Rate
3.44%
Mortgage Type
New Conventional
Estimated Equity
$152,733
Purchase Details
Closed on
Oct 29, 2004
Sold by
Quality 5 Inc
Bought by
Moschella Cynthia
Home Financials for this Owner
Home Financials are based on the most recent Mortgage that was taken out on this home.
Original Mortgage
$49,980
Interest Rate
5.74%
Mortgage Type
Purchase Money Mortgage
Create a Home Valuation Report for This Property
The Home Valuation Report is an in-depth analysis detailing your home's value as well as a comparison with similar homes in the area
Home Values in the Area
Average Home Value in this Area
Purchase History
| Date | Buyer | Sale Price | Title Company |
|---|---|---|---|
| Fleury Orlando | $45,000 | -- | |
| Moschella Edward E | -- | -- | |
| Moschella Cynthia | $75,400 | -- |
Source: Public Records
Mortgage History
| Date | Status | Borrower | Loan Amount |
|---|---|---|---|
| Open | Fleury Orlando | $36,000 | |
| Previous Owner | Moschella Cynthia | $49,980 |
Source: Public Records
Tax History Compared to Growth
Tax History
| Year | Tax Paid | Tax Assessment Tax Assessment Total Assessment is a certain percentage of the fair market value that is determined by local assessors to be the total taxable value of land and additions on the property. | Land | Improvement |
|---|---|---|---|---|
| 2025 | $1,770 | $134,200 | $0 | $134,200 |
| 2024 | $1,822 | $132,500 | $0 | $132,500 |
| 2023 | $1,599 | $111,500 | $0 | $111,500 |
| 2022 | $1,430 | $94,000 | $0 | $94,000 |
| 2021 | $1,293 | $79,400 | $0 | $79,400 |
| 2020 | $944 | $55,500 | $0 | $55,500 |
| 2019 | $1,093 | $60,700 | $0 | $60,700 |
| 2018 | $1,065 | $56,300 | $0 | $56,300 |
| 2017 | $1,119 | $58,200 | $0 | $58,200 |
| 2016 | $940 | $45,600 | $0 | $45,600 |
| 2015 | $915 | $45,600 | $0 | $45,600 |
| 2014 | $854 | $43,700 | $0 | $43,700 |
Source: Public Records
About Madison Tower Condominimums
Map
Nearby Homes
- 70 Southbridge St Unit 310
- 70 Southbridge St Unit 611
- 531 Main St Unit 503
- 531 Main St Unit 410
- 531 Main St Unit 403
- 93 Austin St
- 44 Elm St Unit 501
- 111 Austin St
- 58 Elm St Unit 11
- 56 Elm St Unit 1
- 58 Elm St Unit 1
- 13 West St
- 230 Pleasant St
- 7 Lodi St
- 146 -152 Chandler
- 69 Oread St
- 10 Ellsworth St
- 340 Harding St
- 22 Waverly St
- 12 King St
- 70 Southbridge St Unit 1
- 70 Southbridge St Unit 1017
- 70 Southbridge St Unit 1016
- 70 Southbridge St Unit 1015
- 70 Southbridge St Unit 1014
- 70 Southbridge St Unit 1013
- 70 Southbridge St Unit 1012
- 70 Southbridge St Unit 1011
- 70 Southbridge St Unit 1010
- 70 Southbridge St Unit 1009
- 70 Southbridge St Unit 1007
- 70 Southbridge St Unit 1006
- 70 Southbridge St Unit 1005
- 70 Southbridge St Unit 1004
- 70 Southbridge St Unit 1003
- 70 Southbridge St Unit 1002
- 70 Southbridge St Unit 1001
- 70 Southbridge St Unit 917
- 70 Southbridge St Unit 916
- 70 Southbridge St Unit 914