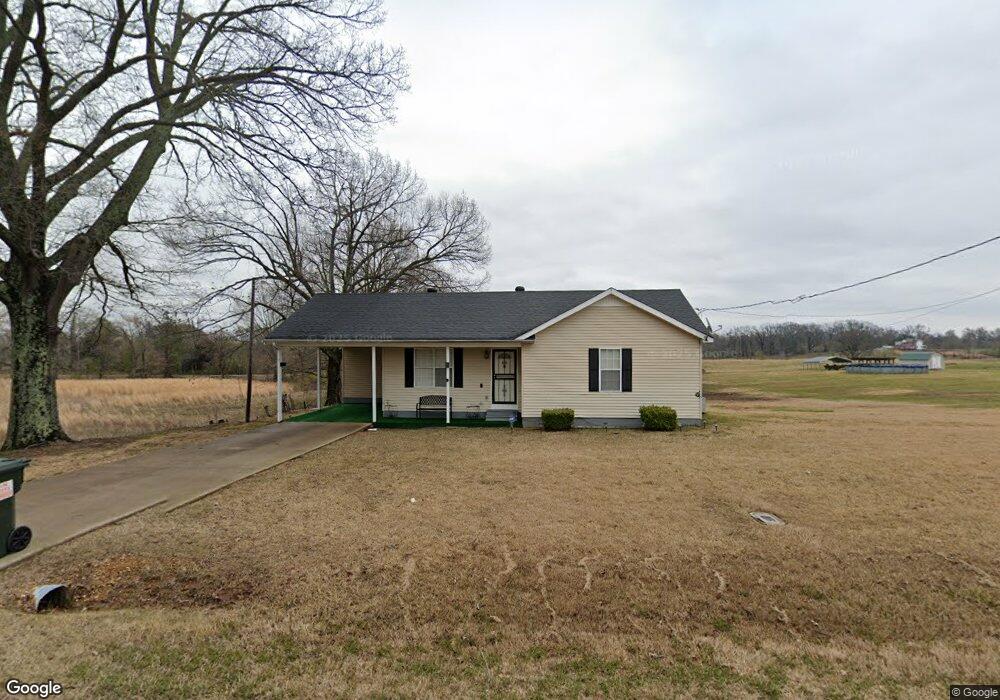
70 Springhill Rd Ripley, TN 38063
Estimated Value: $115,358 - $200,000
Studio
2
Baths
1,014
Sq Ft
$165/Sq Ft
Est. Value
About This Home
This home is located at 70 Springhill Rd, Ripley, TN 38063 and is currently estimated at $167,090, approximately $164 per square foot. 70 Springhill Rd is a home located in Lauderdale County with nearby schools including Ripley Primary School, Ripley Elementary School, and Ripley Middle School.
Ownership History
Date
Name
Owned For
Owner Type
Purchase Details
Closed on
May 3, 2001
Sold by
Laknford Anthony
Bought by
Brian Bratschi
Current Estimated Value
Purchase Details
Closed on
Jul 20, 2000
Sold by
Brian Bratschi and Brian Kim
Bought by
Larry Langley and Larry Kay
Purchase Details
Closed on
Jul 13, 2000
Sold by
Brian Bratschi and Brian Kim
Bought by
Brian Bratschi and Brian Kim
Purchase Details
Closed on
Oct 1, 1997
Sold by
Beaird Daniel R
Bought by
Morton Flora V
Purchase Details
Closed on
Aug 29, 1997
Sold by
Reid Shirley H
Bought by
Beaird Daniel R
Purchase Details
Closed on
Jun 25, 1996
Sold by
Lynette English
Bought by
Carroll Jimmy C
Purchase Details
Closed on
May 23, 1996
Sold by
Jimmy Carroll
Bought by
Lynette English
Purchase Details
Closed on
Jan 19, 1996
Sold by
Anthony and Anthony Lankford
Bought by
Jimmy Carroll
Purchase Details
Closed on
Nov 17, 1995
Bought by
Anthony Lankford Poston Llc
Purchase Details
Closed on
Jan 1, 1988
Bought by
King Rena F
Create a Home Valuation Report for This Property
The Home Valuation Report is an in-depth analysis detailing your home's value as well as a comparison with similar homes in the area
Purchase History
| Date | Buyer | Sale Price | Title Company |
|---|---|---|---|
| Brian Bratschi | $5,000 | -- | |
| Larry Langley | $2,500 | -- | |
| Brian Bratschi | $5,000 | -- | |
| Morton Flora V | $46,500 | -- | |
| Beaird Daniel R | $5,000 | -- | |
| Carroll Jimmy C | $7,000 | -- | |
| Randy Lankford | $5,000 | -- | |
| Lynette English | $10,000 | -- | |
| Jimmy Carroll | $30,000 | -- | |
| Anthony Lankford Poston Llc | $52,000 | -- | |
| King Rena F | -- | -- |
Source: Public Records
Tax History
| Year | Tax Paid | Tax Assessment Tax Assessment Total Assessment is a certain percentage of the fair market value that is determined by local assessors to be the total taxable value of land and additions on the property. | Land | Improvement |
|---|---|---|---|---|
| 2025 | $411 | $16,175 | $1,875 | $14,300 |
| 2024 | $411 | $16,175 | $1,875 | $14,300 |
| 2023 | $411 | $16,175 | $1,875 | $14,300 |
| 2022 | $411 | $16,175 | $1,875 | $14,300 |
| 2021 | $411 | $16,175 | $1,875 | $14,300 |
| 2020 | $397 | $16,175 | $1,875 | $14,300 |
| 2019 | $397 | $13,450 | $1,575 | $11,875 |
| 2018 | $397 | $13,450 | $1,575 | $11,875 |
| 2017 | $400 | $13,450 | $1,575 | $11,875 |
| 2016 | $400 | $13,450 | $1,575 | $11,875 |
| 2015 | $425 | $13,450 | $1,575 | $11,875 |
| 2014 | $425 | $14,650 | $1,650 | $13,000 |
Source: Public Records
Map
Nearby Homes
- 100 Springhill Rd
- 50 Holcomb Rd
- 1714 Conner Whitefield Rd
- 00 Forked Deer Rd
- 849 Belton Rd
- 143 Marys Chapel Rd
- 981 Durhamville Rd
- 000 Conner Whitefield Rd
- 546 Ross Rd
- 0 Forked Deer Rd
- 00 Leggett Rd
- 205 Charles Martin Rd
- 6080 Durhamville Rd
- 2656 Curve Woodville Rd
- 284 Highland St
- 294 Highland Ext St
- 243 Eastend St
- 322 Highland St
- 6277 Conner Whitefield Rd
- 154 S Main St
- 5221 Highway 19 E
- 130 Springhill Rd
- 160 Springhill Rd
- 190 Springhill Rd
- 240 Springhill Rd
- 270 Springhill Rd
- 134 Watson Rd
- 5978 Highway 19 E
- 340 Springhill Rd
- 370 Springhill Rd
- 71 Watson Rd
- 353 Springhill Rd
- 49 Watson Rd
- 19 Watson Rd
- 6005 Highway 19 E
- 5457 Highway 19 E
- 12990 Highway 19 N
- 12838 Highway 19 N
- 12876 Highway 19 N
- 12838 Highway 19 N
Your Personal Tour Guide
Ask me questions while you tour the home.