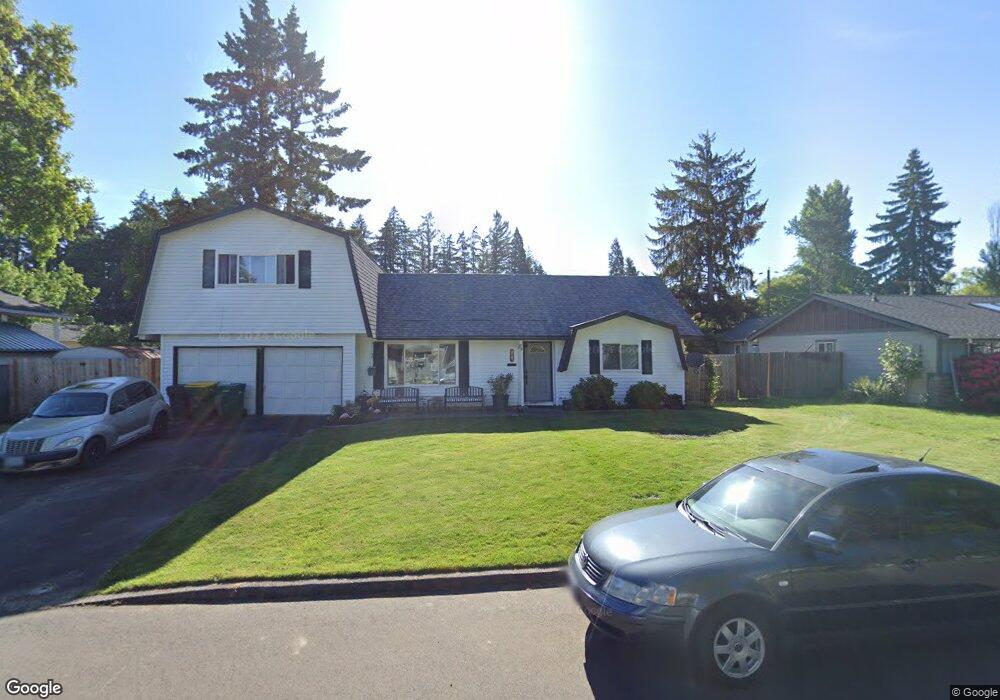
70 SW 142nd Ave Beaverton, OR 97006
Estimated Value: $490,000 - $547,000
3
Beds
2
Baths
1,619
Sq Ft
$323/Sq Ft
Est. Value
About This Home
This home is located at 70 SW 142nd Ave, Beaverton, OR 97006 and is currently estimated at $522,726, approximately $322 per square foot. 70 SW 142nd Ave is a home located in Washington County with nearby schools including Barnes Elementary School, Meadow Park Middle School, and Sunset High School.
Ownership History
Date
Name
Owned For
Owner Type
Purchase Details
Closed on
Aug 7, 2002
Sold by
Kappel Moira K and Kappel James
Bought by
Turnbough Lyle V and Turnbough Denniel L
Current Estimated Value
Home Financials for this Owner
Home Financials are based on the most recent Mortgage that was taken out on this home.
Original Mortgage
$134,050
Outstanding Balance
$55,435
Interest Rate
6.5%
Estimated Equity
$467,291
Purchase Details
Closed on
Jun 3, 1999
Sold by
Watt Joe R and Watt Geraldine
Bought by
Gentrup Moira K and Kappel James
Home Financials for this Owner
Home Financials are based on the most recent Mortgage that was taken out on this home.
Original Mortgage
$138,600
Interest Rate
6.84%
Purchase Details
Closed on
Mar 10, 1999
Sold by
Bankers Trust Company
Bought by
Watt Joe R and Watt Geraldine
Purchase Details
Closed on
May 22, 1998
Sold by
White Nyls F and White Brenda S
Bought by
Dlj Mtg Acceptance Corp
Create a Home Valuation Report for This Property
The Home Valuation Report is an in-depth analysis detailing your home's value as well as a comparison with similar homes in the area
Home Values in the Area
Average Home Value in this Area
Purchase History
| Date | Buyer | Sale Price | Title Company |
|---|---|---|---|
| Turnbough Lyle V | $167,600 | Fidelity National Title Co | |
| Gentrup Moira K | $142,900 | First American Title Ins Co | |
| Watt Joe R | $115,000 | First American Title Ins Co | |
| Dlj Mtg Acceptance Corp | $121,689 | Transnation Title Insurance |
Source: Public Records
Mortgage History
| Date | Status | Borrower | Loan Amount |
|---|---|---|---|
| Open | Turnbough Lyle V | $134,050 | |
| Previous Owner | Gentrup Moira K | $138,600 | |
| Closed | Turnbough Lyle V | $33,500 |
Source: Public Records
Tax History Compared to Growth
Tax History
| Year | Tax Paid | Tax Assessment Tax Assessment Total Assessment is a certain percentage of the fair market value that is determined by local assessors to be the total taxable value of land and additions on the property. | Land | Improvement |
|---|---|---|---|---|
| 2026 | $4,375 | $248,800 | -- | -- |
| 2025 | $4,375 | $241,560 | -- | -- |
| 2024 | $4,108 | $234,530 | -- | -- |
| 2023 | $4,108 | $227,700 | $0 | $0 |
| 2022 | $3,975 | $227,700 | $0 | $0 |
| 2021 | $3,832 | $214,640 | $0 | $0 |
| 2020 | $3,716 | $208,390 | $0 | $0 |
| 2019 | $3,595 | $202,330 | $0 | $0 |
| 2018 | $3,477 | $196,440 | $0 | $0 |
| 2017 | $3,352 | $190,720 | $0 | $0 |
| 2016 | $3,233 | $185,170 | $0 | $0 |
| 2015 | $3,108 | $179,780 | $0 | $0 |
| 2014 | $3,046 | $174,550 | $0 | $0 |
Source: Public Records
Map
Nearby Homes
- 13860 SW Butner Rd
- 606 SW Dillan Dr
- 650 SW Meadow Dr Unit 211
- 650 SW Meadow Dr Unit 106
- 650 SW Meadow Dr Unit 218
- 650 SW Meadow Dr Unit 222
- 650 SW Meadow Dr Unit 103
- 245 SW 133rd Ave
- 122 NW 152nd Ave
- 13115 NW Glenridge Dr
- 14095 SW Walker Rd Unit 95
- 13120 SW Rita Dr
- 12618 NW Barnes Rd Unit 11
- 12622 NW Barnes Rd
- 12612 NW Barnes Rd Unit 6
- 12620 NW Barnes Rd Unit 5
- 13845 SW Far Vista Dr
- 961 SW Stellar Terrace
- 1400 NW 137th Ave
- 13520 SW Devonshire Dr
- 90 SW 142nd Ave
- 50 SW 142nd Ave
- 14110 SW Todd St
- 14140 SW Todd St
- 14096 SW Todd St
- 65 SW 142nd Ave
- 85 SW 142nd Ave
- 110 SW 142nd Ave
- 45 SW 142nd Ave
- 115 SW 142nd Ave
- 130 SW 142nd Ave
- 90 SW 143rd Ave
- 14195 SW Todd St
- 14175 SW Todd St
- 110 SW 143rd Ave
- 14107 SW Todd St
- 14225 SW Todd St
- 14155 SW Todd St
- 135 SW 142nd Ave
- 14070 SW Todd St