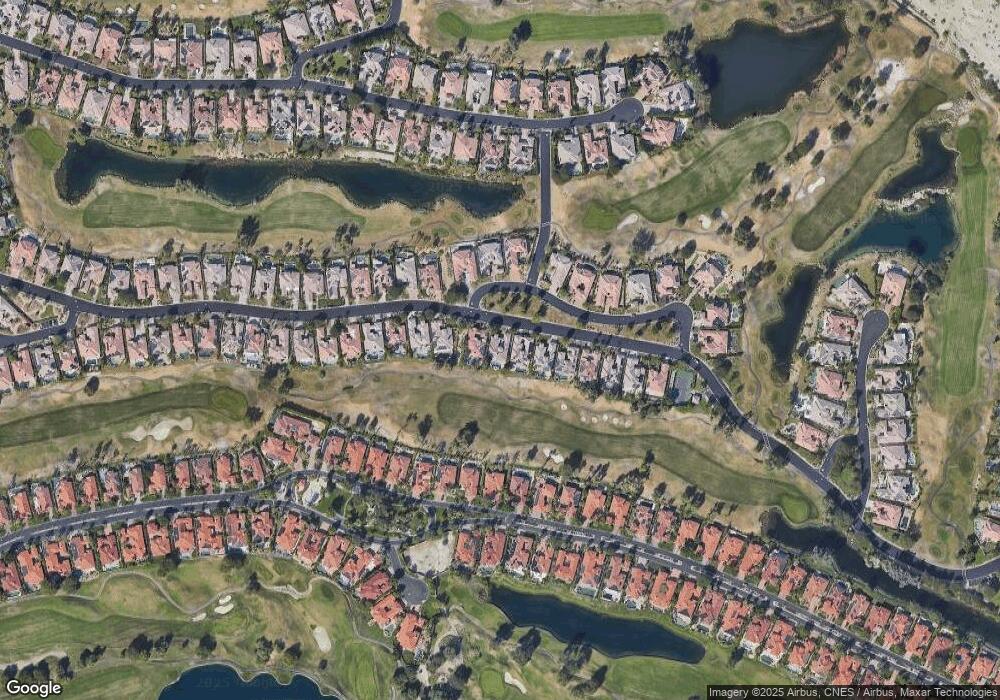
70 Via Bella Rancho Mirage, CA 92270
Estimated Value: $1,139,000 - $1,470,000
3
Beds
3
Baths
3,250
Sq Ft
$402/Sq Ft
Est. Value
About This Home
This home is located at 70 Via Bella, Rancho Mirage, CA 92270 and is currently estimated at $1,308,000, approximately $402 per square foot. 70 Via Bella is a home located in Riverside County with nearby schools including Sunny Sands Elementary School, Nellie N. Coffman Middle School, and Rancho Mirage High.
Ownership History
Date
Name
Owned For
Owner Type
Purchase Details
Closed on
Sep 24, 2014
Sold by
Jacobs Gary and Jacobs Carolyn
Bought by
Jacobs Family Trust
Current Estimated Value
Purchase Details
Closed on
Aug 4, 2010
Sold by
Kurbikoff Marie Creamer
Bought by
Jacobs Gary and Jacobs Carolyn
Home Financials for this Owner
Home Financials are based on the most recent Mortgage that was taken out on this home.
Original Mortgage
$500,000
Outstanding Balance
$330,213
Interest Rate
4.52%
Mortgage Type
New Conventional
Estimated Equity
$977,787
Purchase Details
Closed on
Mar 27, 2002
Sold by
Toll Ca Ii Lp
Bought by
Klein Rodney G
Home Financials for this Owner
Home Financials are based on the most recent Mortgage that was taken out on this home.
Original Mortgage
$403,000
Interest Rate
5.11%
Create a Home Valuation Report for This Property
The Home Valuation Report is an in-depth analysis detailing your home's value as well as a comparison with similar homes in the area
Home Values in the Area
Average Home Value in this Area
Purchase History
| Date | Buyer | Sale Price | Title Company |
|---|---|---|---|
| Jacobs Family Trust | -- | None Available | |
| Jacobs Gary | $642,500 | Equity Title-Orange County-I | |
| Klein Rodney G | $504,000 | Chicago Title Co |
Source: Public Records
Mortgage History
| Date | Status | Borrower | Loan Amount |
|---|---|---|---|
| Open | Jacobs Gary | $500,000 | |
| Previous Owner | Klein Rodney G | $403,000 |
Source: Public Records
Tax History Compared to Growth
Tax History
| Year | Tax Paid | Tax Assessment Tax Assessment Total Assessment is a certain percentage of the fair market value that is determined by local assessors to be the total taxable value of land and additions on the property. | Land | Improvement |
|---|---|---|---|---|
| 2025 | $11,130 | $822,501 | $278,005 | $544,496 |
| 2023 | $11,130 | $790,563 | $267,210 | $523,353 |
| 2022 | $10,917 | $775,063 | $261,971 | $513,092 |
| 2021 | $10,677 | $759,867 | $256,835 | $503,032 |
| 2020 | $10,180 | $752,077 | $254,202 | $497,875 |
| 2019 | $10,094 | $737,331 | $249,218 | $488,113 |
| 2018 | $9,827 | $722,875 | $244,333 | $478,542 |
| 2017 | $9,703 | $708,702 | $239,543 | $469,159 |
| 2016 | $9,370 | $694,807 | $234,847 | $459,960 |
| 2015 | $9,071 | $684,371 | $231,320 | $453,051 |
| 2014 | $9,045 | $670,967 | $226,790 | $444,177 |
Source: Public Records
Map
Nearby Homes