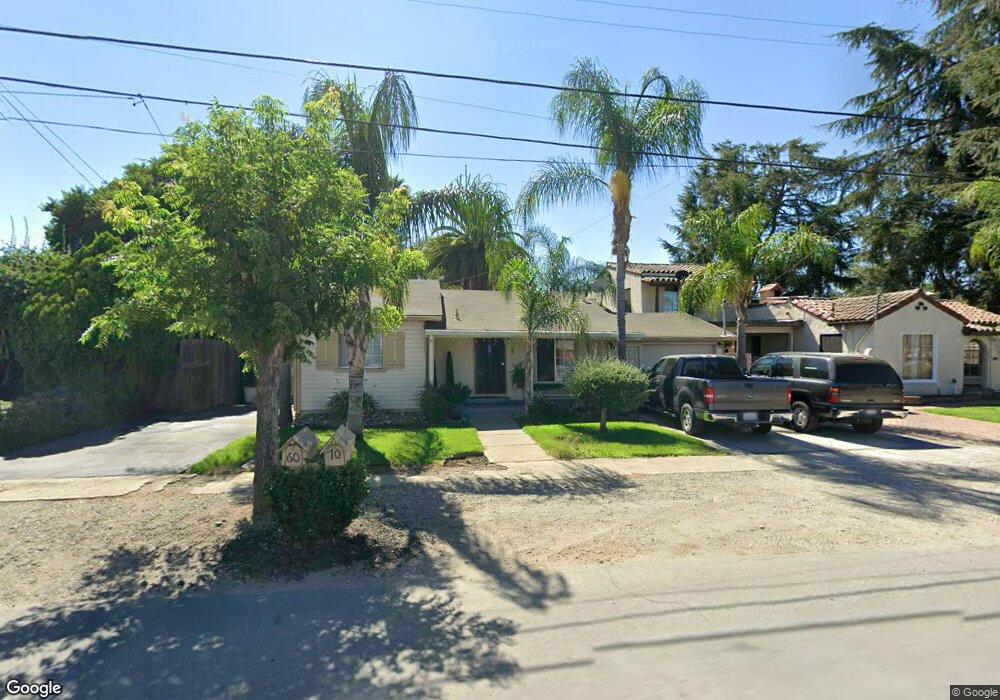
70 W San Martin Ave San Martin, CA 95046
Estimated Value: $632,188 - $1,139,000
1
Bed
1
Bath
600
Sq Ft
$1,552/Sq Ft
Est. Value
About This Home
This home is located at 70 W San Martin Ave, San Martin, CA 95046 and is currently estimated at $931,047, approximately $1,551 per square foot. 70 W San Martin Ave is a home located in Santa Clara County with nearby schools including San Martin/Gwinn Environmental Science Academy, Britton Middle School, and Live Oak High School.
Ownership History
Date
Name
Owned For
Owner Type
Purchase Details
Closed on
Jan 31, 2008
Sold by
Flores Edgar
Bought by
Flores Edgar and Flores Martha
Current Estimated Value
Purchase Details
Closed on
Dec 6, 1999
Sold by
Ralph Eason and Ralph Rose M
Bought by
Flores Edgar A and Flores Martha
Home Financials for this Owner
Home Financials are based on the most recent Mortgage that was taken out on this home.
Original Mortgage
$199,875
Outstanding Balance
$70,296
Interest Rate
9.5%
Estimated Equity
$860,751
Purchase Details
Closed on
Feb 19, 1997
Sold by
Bingham Timothy P
Bought by
Eason Ralph and Eason Rose M
Home Financials for this Owner
Home Financials are based on the most recent Mortgage that was taken out on this home.
Original Mortgage
$148,000
Interest Rate
7.86%
Purchase Details
Closed on
Feb 10, 1997
Sold by
Bingham Sandra L
Bought by
Bingham Timothy P
Home Financials for this Owner
Home Financials are based on the most recent Mortgage that was taken out on this home.
Original Mortgage
$148,000
Interest Rate
7.86%
Create a Home Valuation Report for This Property
The Home Valuation Report is an in-depth analysis detailing your home's value as well as a comparison with similar homes in the area
Home Values in the Area
Average Home Value in this Area
Purchase History
| Date | Buyer | Sale Price | Title Company |
|---|---|---|---|
| Flores Edgar | -- | North American Title Company | |
| Flores Edgar A | $266,500 | Stewart Title | |
| Eason Ralph | $185,000 | Old Republic Title Company | |
| Bingham Timothy P | -- | Old Republic Title Company |
Source: Public Records
Mortgage History
| Date | Status | Borrower | Loan Amount |
|---|---|---|---|
| Open | Flores Edgar A | $199,875 | |
| Previous Owner | Eason Ralph | $148,000 | |
| Closed | Flores Edgar A | $66,625 |
Source: Public Records
Tax History Compared to Growth
Tax History
| Year | Tax Paid | Tax Assessment Tax Assessment Total Assessment is a certain percentage of the fair market value that is determined by local assessors to be the total taxable value of land and additions on the property. | Land | Improvement |
|---|---|---|---|---|
| 2025 | $4,763 | $409,580 | $192,110 | $217,470 |
| 2024 | $4,763 | $401,550 | $188,344 | $213,206 |
| 2023 | $4,701 | $393,677 | $184,651 | $209,026 |
| 2022 | $4,621 | $385,959 | $181,031 | $204,928 |
| 2021 | $4,507 | $378,392 | $177,482 | $200,910 |
| 2020 | $4,400 | $374,513 | $175,663 | $198,850 |
| 2019 | $4,521 | $367,170 | $172,219 | $194,951 |
| 2018 | $4,531 | $359,972 | $168,843 | $191,129 |
| 2017 | $4,488 | $352,915 | $165,533 | $187,382 |
| 2016 | $3,191 | $258,900 | $120,900 | $138,000 |
| 2015 | $2,903 | $233,300 | $109,400 | $123,900 |
| 2014 | $2,820 | $220,100 | $103,200 | $116,900 |
Source: Public Records
Map
Nearby Homes
- 30 Chester Ave
- 0 W San Martin Ave
- 12645 Harding Ave
- 0 Llagas Ave Unit ML82019140
- 13690 Murphy Ave #E
- 12755 Santa Teresa Blvd
- 905 E San Martin Ave
- 13705 Sycamore Ave
- 13640 Sycamore Ave
- 14325 Monterey Rd
- 12320 Highland Estates Ln
- 12315 Harding Ave
- 14430 Monterey Hwy
- 13755 Columbet Ave
- 475 E Middle Ave
- 1935 Hayes Ln
- 1265 Lions Peak Ln
- 42 Dewey Cir
- 13035 Center Ave
- 56 Creekside Dr Unit 56
- 90 W San Martin Ave
- 70 Chester Ave
- 50 W San Martin Ave
- 50 W San Martin Ave
- 50 Chester Ave
- 40 Chester St
- 30 W San Martin Ave
- 110 W San Martin Ave
- 75 W San Martin Ave
- 13310 Sewell Ave
- 13275 Sewell Ave
- 30 Chester St
- 35 W San Martin Ave
- 20 Chester St
- 65 Chester St
- 130 W San Martin Ave
- 45 Chester St
- 80 Chester St
- 13305 Monterey Hwy
- 13330 Sewell Ave