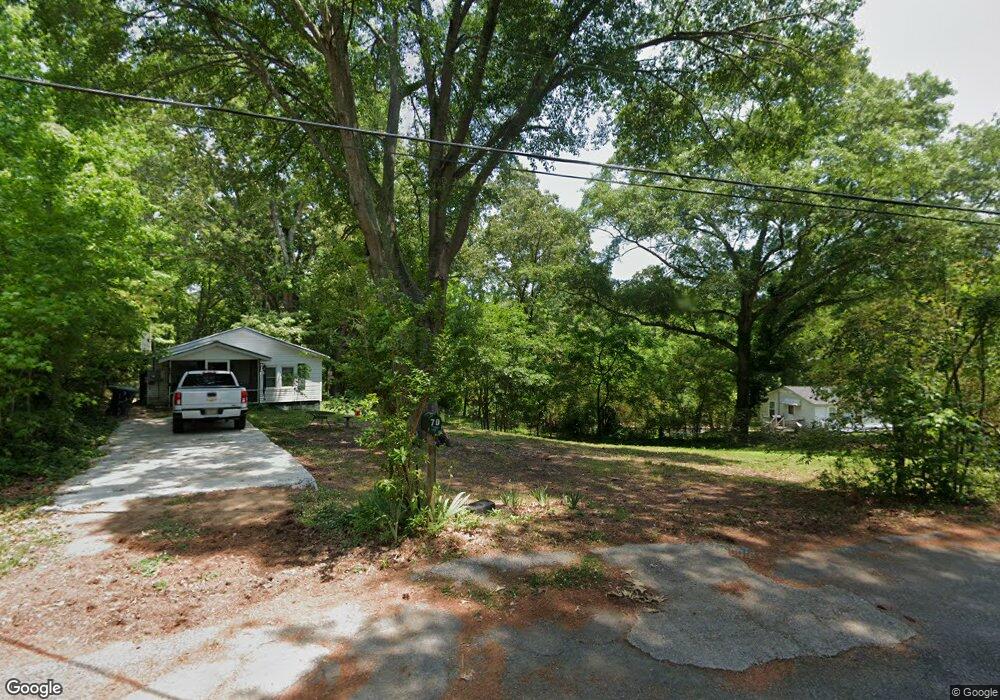
70 Watson St Toccoa, GA 30577
Estimated Value: $66,322 - $166,000
2
Beds
1
Bath
631
Sq Ft
$177/Sq Ft
Est. Value
About This Home
This home is located at 70 Watson St, Toccoa, GA 30577 and is currently estimated at $111,831, approximately $177 per square foot. 70 Watson St is a home located in Stephens County with nearby schools including Stephens County High School.
Ownership History
Date
Name
Owned For
Owner Type
Purchase Details
Closed on
Jul 30, 2018
Sold by
Kensey Ceus
Bought by
Strickland Thomas M
Current Estimated Value
Purchase Details
Closed on
Jul 13, 2004
Sold by
Shirley Glenn B
Bought by
Ceus Kensey
Purchase Details
Closed on
Feb 19, 2002
Sold by
Turner Jane K
Bought by
Shirley Glenn B
Purchase Details
Closed on
Nov 16, 2001
Sold by
Turner Jane K Charlie L Lisa M and Turner Jane K James
Bought by
Turner Jane K
Purchase Details
Closed on
Mar 12, 1996
Sold by
Justice Della and J C
Bought by
Turner James Walter
Purchase Details
Closed on
Oct 12, 1979
Sold by
Defoor Alton
Bought by
Justice Fred Mrs and Justice John
Purchase Details
Closed on
Apr 1, 1966
Sold by
Martin Lumber Company
Bought by
Defoor Alton
Purchase Details
Closed on
Mar 21, 1957
Sold by
Whitworth C W
Bought by
Jameson Arvel
Purchase Details
Closed on
Nov 17, 1952
Sold by
Stancil Lam D
Bought by
Whitworth C W
Purchase Details
Closed on
Mar 1, 1949
Sold by
Cleveland Percy
Bought by
Stancil Lam D
Create a Home Valuation Report for This Property
The Home Valuation Report is an in-depth analysis detailing your home's value as well as a comparison with similar homes in the area
Purchase History
| Date | Buyer | Sale Price | Title Company |
|---|---|---|---|
| Strickland Thomas M | $30,500 | -- | |
| Ceus Kensey | $36,000 | -- | |
| Shirley Glenn B | $18,000 | -- | |
| Turner Jane K | -- | -- | |
| Turner James Walter | -- | -- | |
| Justice Fred Mrs | -- | -- | |
| Defoor Alton | -- | -- | |
| Jameson Arvel | -- | -- | |
| Whitworth C W | -- | -- | |
| Stancil Lam D | -- | -- |
Source: Public Records
Tax History
| Year | Tax Paid | Tax Assessment Tax Assessment Total Assessment is a certain percentage of the fair market value that is determined by local assessors to be the total taxable value of land and additions on the property. | Land | Improvement |
|---|---|---|---|---|
| 2025 | $72 | $18,953 | $3,327 | $15,626 |
| 2024 | $72 | $13,795 | $3,327 | $10,468 |
| 2023 | $73 | $13,063 | $3,327 | $9,736 |
| 2022 | $404 | $11,433 | $3,327 | $8,106 |
| 2021 | $403 | $10,831 | $3,327 | $7,504 |
| 2020 | $403 | $10,722 | $3,327 | $7,395 |
| 2019 | $404 | $10,722 | $3,327 | $7,395 |
| 2018 | $288 | $10,553 | $4,801 | $5,752 |
| 2017 | $340 | $10,553 | $4,801 | $5,752 |
| 2016 | $335 | $10,552 | $4,800 | $5,751 |
| 2015 | $392 | $11,800 | $4,800 | $7,000 |
| 2014 | $398 | $11,801 | $4,801 | $7,000 |
| 2013 | -- | $11,800 | $4,800 | $7,000 |
Source: Public Records
Map
Nearby Homes
- 326 Remsdale Rd
- 596 Watson St
- 481 W Currahee St
- 18 W Currahee St
- 10 Busha St
- 259 E Currahee St
- 120 S Pine St
- 51 Busha St
- 27 Rock Quarry Rd
- 198 S Broad St
- 239 E Doyle St
- 109 Schaefer Ct
- 31 Craig St
- 345 Prather Bridge Rd
- 288 S Broad St
- 35 Green Hill Place
- 50 Green Hill Place
- 84 Oak Creek Cir
- 53 Cole Manor Dr
- 84 Park St
- 70 Watson Extension
- 52 Watson St
- 35 Jewell St
- 40 Watson St
- 45 Watson Extension
- 61 Henderson Falls Rd
- 639 Falls Rd
- 63 Henderson Falls Rd
- 470 Falls Rd
- 141 Henderson Falls Rd
- 531 Falls Rd
- 19 Cooper St
- 159 Henderson Falls Rd
- 80 Jewell St
- 580 Falls Rd
- 585 Falls Rd
- 171 Henderson Falls Rd
- 114 Watson St
- 14 Henderson Falls Rd
- 132 Henderson Falls Rd