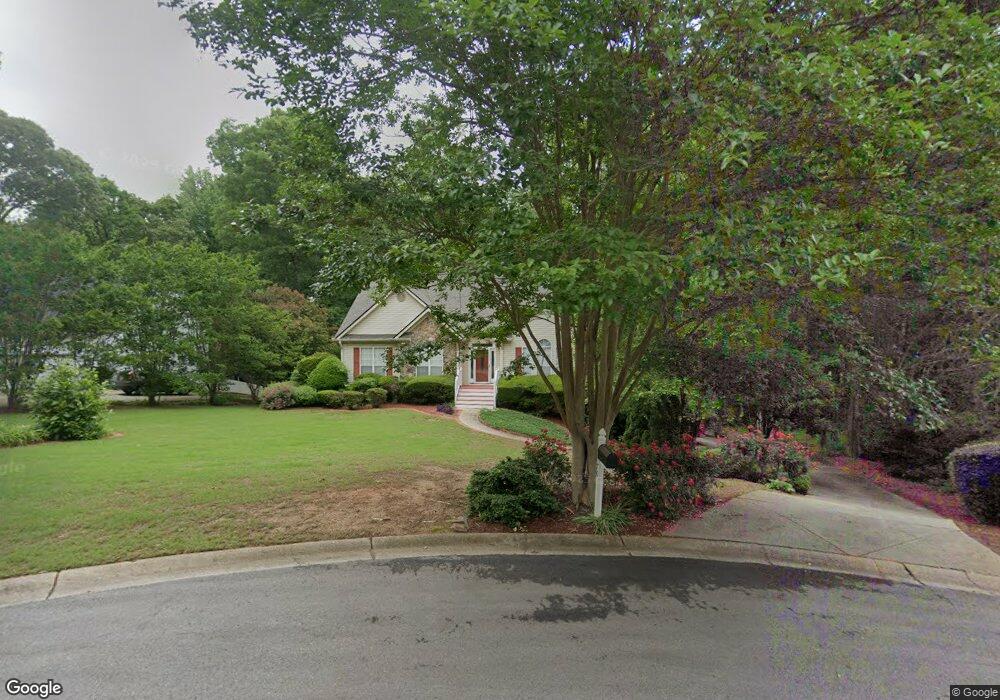
70 Wenham Ln Unit 6 Sharpsburg, GA 30277
Estimated Value: $307,000 - $396,000
3
Beds
2
Baths
1,624
Sq Ft
$221/Sq Ft
Est. Value
About This Home
This home is located at 70 Wenham Ln Unit 6, Sharpsburg, GA 30277 and is currently estimated at $359,153, approximately $221 per square foot. 70 Wenham Ln Unit 6 is a home located in Coweta County with nearby schools including Canongate Elementary School, Madras Middle School, and Northgate High School.
Ownership History
Date
Name
Owned For
Owner Type
Purchase Details
Closed on
Oct 31, 2012
Sold by
Webster Beverly B
Bought by
Webster Melvin M
Current Estimated Value
Purchase Details
Closed on
Oct 28, 1999
Sold by
Cox Donald T and Cox Tammy
Bought by
Webster Melvin M and Webster Beverly B
Home Financials for this Owner
Home Financials are based on the most recent Mortgage that was taken out on this home.
Original Mortgage
$134,900
Interest Rate
7.76%
Mortgage Type
New Conventional
Purchase Details
Closed on
Sep 15, 1994
Sold by
Parks Charles
Bought by
Cox Donald Tammy
Home Financials for this Owner
Home Financials are based on the most recent Mortgage that was taken out on this home.
Original Mortgage
$88,000
Interest Rate
8.37%
Mortgage Type
Purchase Money Mortgage
Purchase Details
Closed on
May 13, 1994
Sold by
Parks Charles L
Bought by
Parks Charles L
Purchase Details
Closed on
Oct 30, 1993
Bought by
Rockport Inc
Create a Home Valuation Report for This Property
The Home Valuation Report is an in-depth analysis detailing your home's value as well as a comparison with similar homes in the area
Home Values in the Area
Average Home Value in this Area
Purchase History
| Date | Buyer | Sale Price | Title Company |
|---|---|---|---|
| Webster Melvin M | -- | -- | |
| Webster Melvin M | $149,900 | -- | |
| Cox Donald Tammy | $121,900 | -- | |
| Parks Charles L | $39,500 | -- | |
| Rockport Inc | $1,000 | -- |
Source: Public Records
Mortgage History
| Date | Status | Borrower | Loan Amount |
|---|---|---|---|
| Previous Owner | Webster Melvin M | $134,900 | |
| Previous Owner | Cox Donald Tammy | $88,000 |
Source: Public Records
Tax History Compared to Growth
Tax History
| Year | Tax Paid | Tax Assessment Tax Assessment Total Assessment is a certain percentage of the fair market value that is determined by local assessors to be the total taxable value of land and additions on the property. | Land | Improvement |
|---|---|---|---|---|
| 2025 | $1,543 | $141,892 | $30,000 | $111,892 |
| 2024 | $1,497 | $144,090 | $30,000 | $114,090 |
| 2023 | $1,497 | $120,061 | $22,000 | $98,061 |
| 2022 | $1,354 | $113,576 | $22,000 | $91,576 |
| 2021 | $889 | $92,476 | $22,000 | $70,476 |
| 2020 | $890 | $92,476 | $22,000 | $70,476 |
| 2019 | $1,177 | $69,159 | $12,000 | $57,159 |
| 2018 | $1,181 | $69,159 | $12,000 | $57,159 |
| 2017 | $1,049 | $64,658 | $12,000 | $52,658 |
| 2016 | $1,873 | $64,658 | $12,000 | $52,658 |
| 2015 | $1,687 | $59,258 | $12,000 | $47,258 |
| 2014 | $1,489 | $57,258 | $10,000 | $47,258 |
Source: Public Records
Map
Nearby Homes
- 40 Wenham Ln
- 10 Monteray Ct
- 70 N Strathmore Dr
- 259 Strathmore Dr Unit 3
- 20 Skipton Ct
- 46 I W Brooks Rd
- 131 Cannongate Cir
- 127 Northgate Preserve Dr
- 125 Cannongate Cir
- 12 Race Point Way
- 972 Raymond Hill Rd
- 9 Warrior Way
- 319 Beaconsfield Dr
- 306 Northgate Preserve Dr
- 95 Tyler Woods Dr
- 851 Raymond Hill Rd
- 0 Fischer Spur Rd Unit 10495301
- 25 Sycamore Way
- 2043 Fischer Rd
- 2039 Fischer Rd
- 80 Wenham Ln
- 60 Wenham Ln
- 15 Monteray Ct Unit 7
- 75 Wenham Ln
- 35 Heathridge Dr Unit 7
- 5 Monteray Ct Unit 7
- 65 Wenham Ln Unit 6
- 19 Endicott Ct
- 25 Heathridge Dr Unit 7
- 0 Wenham Ln Unit 8809473
- 0 Wenham Ln Unit 8633597
- 0 Wenham Ln Unit 8480945
- 20 Monteray Ct
- 0 Endicott Ct
- 9 Endicott Ct
- 15 Heathridge Dr
- 15 Heathridge Dr Unit 165
- 35 Wenham Ln Unit 6
- 60 Heathridge Dr
- 20 Endicott Ct Unit 6