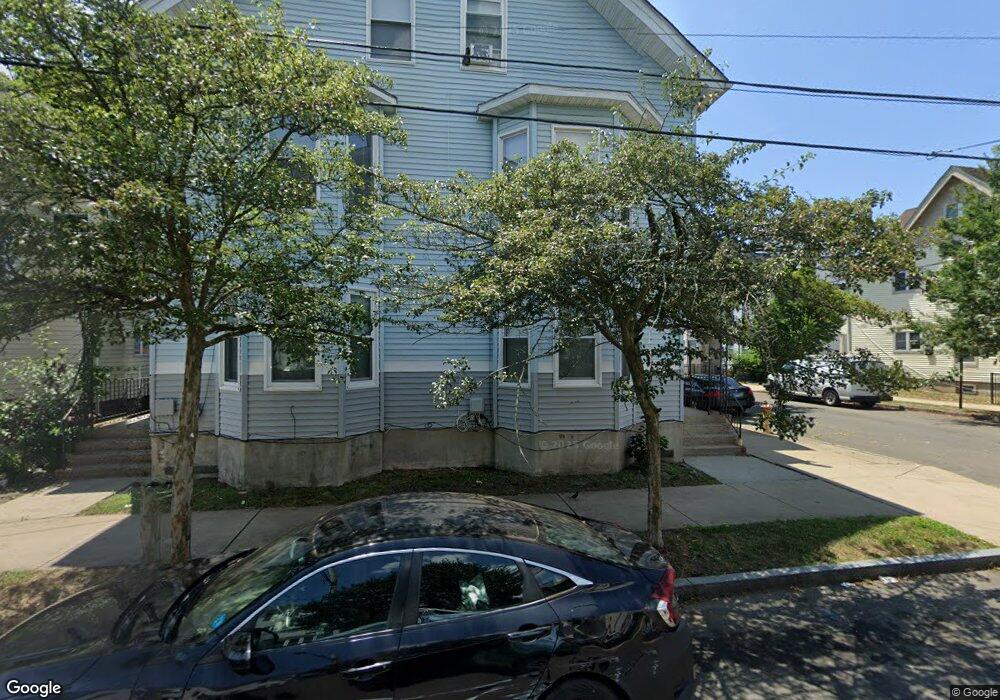
70 Wolcott St New Haven, CT 06513
Fair Haven NeighborhoodEstimated Value: $199,314 - $526,000
8
Beds
4
Baths
3,130
Sq Ft
$130/Sq Ft
Est. Value
About This Home
This home is located at 70 Wolcott St, New Haven, CT 06513 and is currently estimated at $405,829, approximately $129 per square foot. 70 Wolcott St is a home located in New Haven County with nearby schools including Fair Haven School, Elm City College Preparatory School, and Cold Spring School.
Ownership History
Date
Name
Owned For
Owner Type
Purchase Details
Closed on
Dec 22, 1998
Sold by
Dimicco Carmen
Bought by
Richard St Lp
Current Estimated Value
Home Financials for this Owner
Home Financials are based on the most recent Mortgage that was taken out on this home.
Original Mortgage
$20,000
Outstanding Balance
$4,629
Interest Rate
7%
Estimated Equity
$401,200
Create a Home Valuation Report for This Property
The Home Valuation Report is an in-depth analysis detailing your home's value as well as a comparison with similar homes in the area
Home Values in the Area
Average Home Value in this Area
Purchase History
| Date | Buyer | Sale Price | Title Company |
|---|---|---|---|
| Richard St Lp | $62,000 | -- |
Source: Public Records
Mortgage History
| Date | Status | Borrower | Loan Amount |
|---|---|---|---|
| Open | Richard St Lp | $20,000 | |
| Previous Owner | Richard St Lp | $5,800 | |
| Closed | Richard St Lp | $40,800 |
Source: Public Records
Tax History Compared to Growth
Tax History
| Year | Tax Paid | Tax Assessment Tax Assessment Total Assessment is a certain percentage of the fair market value that is determined by local assessors to be the total taxable value of land and additions on the property. | Land | Improvement |
|---|---|---|---|---|
| 2025 | $7,289 | $185,010 | $39,480 | $145,530 |
| 2024 | $7,123 | $185,010 | $39,480 | $145,530 |
| 2023 | $6,882 | $185,010 | $39,480 | $145,530 |
| 2022 | $7,354 | $185,010 | $39,480 | $145,530 |
| 2021 | $1,954 | $44,528 | $31,570 | $12,958 |
| 2020 | $1,954 | $44,528 | $31,570 | $12,958 |
| 2019 | $1,914 | $44,528 | $31,570 | $12,958 |
| 2018 | $1,914 | $44,528 | $31,570 | $12,958 |
| 2017 | $4,281 | $110,670 | $31,570 | $79,100 |
| 2016 | $1,082 | $26,029 | $14,350 | $11,679 |
| 2015 | $1,082 | $26,029 | $14,350 | $11,679 |
| 2014 | $1,082 | $26,029 | $14,350 | $11,679 |
Source: Public Records
Map
Nearby Homes
- 35 Saltonstall Ave
- 114 Blatchley Ave
- 111 Chapel St
- 56 Woolsey St
- 85 Pierpont St
- 187 Saltonstall Ave
- 191 Ferry St
- 72 Pierpont St
- 213 Saltonstall Ave
- 83 James St
- 33 Chapel St
- 71 Houston St
- 181 James St
- 32 E Pearl St
- 308 Poplar St
- 36 Shelter St
- 43 E Pearl St
- 1 Front St Unit 1 Kel
- 295 Lloyd St
- 8 Front St Unit D