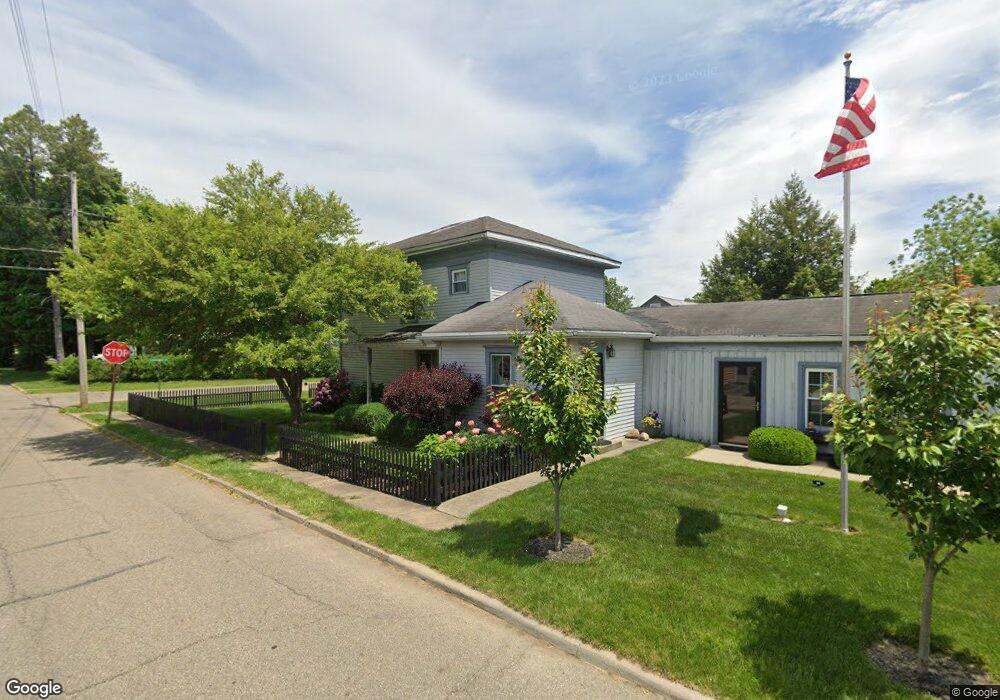
700 E Chestnut St Mount Vernon, OH 43050
Estimated Value: $272,000 - $350,000
3
Beds
2
Baths
2,116
Sq Ft
$145/Sq Ft
Est. Value
About This Home
This home is located at 700 E Chestnut St, Mount Vernon, OH 43050 and is currently estimated at $306,259, approximately $144 per square foot. 700 E Chestnut St is a home with nearby schools including Mount Vernon High School, St. Vincent de Paul School, and Christian Star Academy.
Ownership History
Date
Name
Owned For
Owner Type
Purchase Details
Closed on
Apr 8, 2002
Sold by
Hall Vickie S and Hall Sammie T
Bought by
Tripp Matthew and Tripp Angela
Current Estimated Value
Purchase Details
Closed on
Jan 20, 1999
Sold by
Vanhouten Jon P and Vanhouten Linda L
Bought by
Hall Vickie S and Hall Sammie T
Purchase Details
Closed on
Aug 12, 1996
Sold by
Newland Donald D and Newland Irma
Bought by
Vanhouten Jon P and Vanhouten Linda L
Purchase Details
Closed on
Feb 22, 1995
Sold by
Meharry Ronald L
Bought by
Newland Donald D and Newland Irma
Purchase Details
Closed on
Feb 21, 1995
Sold by
Bond James Franklin and Bond Jud
Bought by
Meharry Ronald L
Create a Home Valuation Report for This Property
The Home Valuation Report is an in-depth analysis detailing your home's value as well as a comparison with similar homes in the area
Home Values in the Area
Average Home Value in this Area
Purchase History
| Date | Buyer | Sale Price | Title Company |
|---|---|---|---|
| Tripp Matthew | $113,000 | -- | |
| Hall Vickie S | $84,000 | -- | |
| Vanhouten Jon P | $73,900 | -- | |
| Newland Donald D | $20,000 | -- | |
| Meharry Ronald L | $14,300 | -- |
Source: Public Records
Tax History Compared to Growth
Tax History
| Year | Tax Paid | Tax Assessment Tax Assessment Total Assessment is a certain percentage of the fair market value that is determined by local assessors to be the total taxable value of land and additions on the property. | Land | Improvement |
|---|---|---|---|---|
| 2024 | $2,680 | $69,330 | $20,910 | $48,420 |
| 2023 | $2,680 | $69,330 | $20,910 | $48,420 |
| 2022 | $2,354 | $55,450 | $16,720 | $38,730 |
| 2021 | $2,354 | $55,450 | $16,720 | $38,730 |
| 2020 | $2,293 | $55,450 | $16,720 | $38,730 |
| 2019 | $2,205 | $49,720 | $18,060 | $31,660 |
| 2018 | $2,205 | $49,720 | $18,060 | $31,660 |
| 2017 | $2,166 | $49,720 | $18,060 | $31,660 |
| 2016 | $2,009 | $46,030 | $16,720 | $29,310 |
| 2015 | $2,017 | $46,030 | $16,720 | $29,310 |
| 2014 | $2,028 | $46,030 | $16,720 | $29,310 |
| 2013 | $2,163 | $46,760 | $20,210 | $26,550 |
Source: Public Records
Map
Nearby Homes