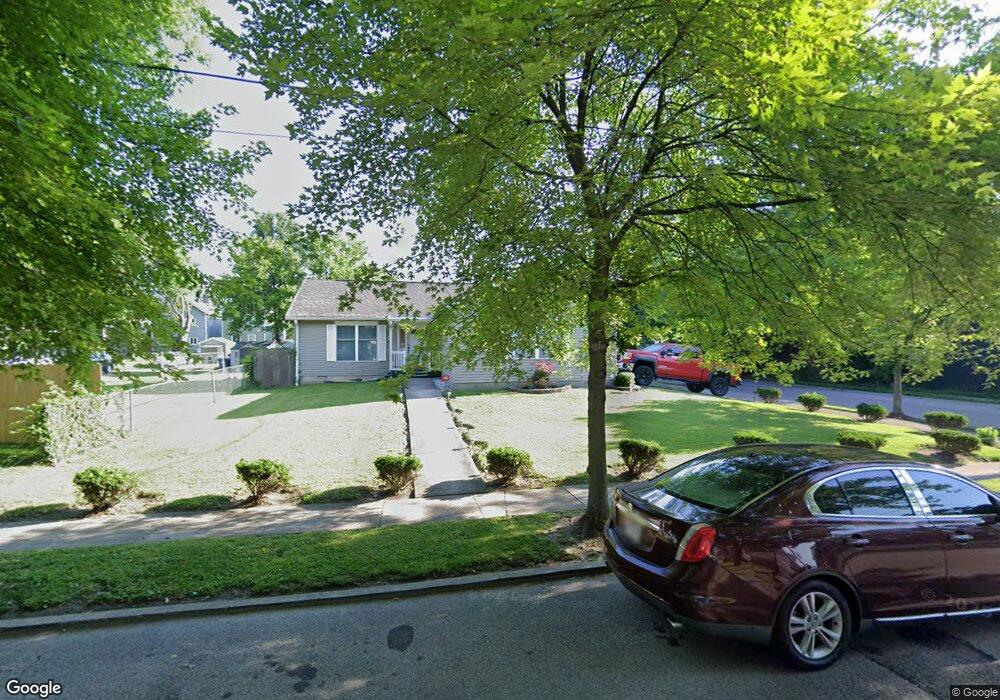
700 Maple St Wyoming, OH 45215
Estimated Value: $146,000 - $191,000
3
Beds
2
Baths
1,344
Sq Ft
$130/Sq Ft
Est. Value
About This Home
This home is located at 700 Maple St, Wyoming, OH 45215 and is currently estimated at $174,840, approximately $130 per square foot. 700 Maple St is a home located in Hamilton County with nearby schools including Lockland Elementary School, Lockland Middle School, and Lockland High School.
Ownership History
Date
Name
Owned For
Owner Type
Purchase Details
Closed on
Jun 30, 2003
Sold by
Cincinnati Housing Partners Inc
Bought by
Custard Michael T
Current Estimated Value
Home Financials for this Owner
Home Financials are based on the most recent Mortgage that was taken out on this home.
Original Mortgage
$78,550
Outstanding Balance
$32,360
Interest Rate
5.31%
Mortgage Type
VA
Estimated Equity
$142,480
Purchase Details
Closed on
Feb 20, 2003
Sold by
Community Improvement Corp Of Lockland
Bought by
Cincinnati Housing Partners Inc
Purchase Details
Closed on
May 8, 2000
Sold by
The Stanley Group
Bought by
Community Improvement Corp Of Lockland
Purchase Details
Closed on
Apr 12, 2000
Sold by
Traylor Jimmie L and Traylor Jane
Bought by
The Stanley Group
Create a Home Valuation Report for This Property
The Home Valuation Report is an in-depth analysis detailing your home's value as well as a comparison with similar homes in the area
Home Values in the Area
Average Home Value in this Area
Purchase History
| Date | Buyer | Sale Price | Title Company |
|---|---|---|---|
| Custard Michael T | $105,000 | -- | |
| Cincinnati Housing Partners Inc | -- | -- | |
| Community Improvement Corp Of Lockland | -- | -- | |
| The Stanley Group | $2,079 | -- |
Source: Public Records
Mortgage History
| Date | Status | Borrower | Loan Amount |
|---|---|---|---|
| Open | Custard Michael T | $78,550 |
Source: Public Records
Tax History
| Year | Tax Paid | Tax Assessment Tax Assessment Total Assessment is a certain percentage of the fair market value that is determined by local assessors to be the total taxable value of land and additions on the property. | Land | Improvement |
|---|---|---|---|---|
| 2025 | $2,387 | $42,365 | $5,534 | $36,831 |
| 2023 | $2,410 | $42,365 | $5,534 | $36,831 |
| 2022 | $2,441 | $34,437 | $3,927 | $30,510 |
| 2021 | $2,470 | $34,437 | $3,927 | $30,510 |
| 2020 | $2,116 | $34,437 | $3,927 | $30,510 |
| 2019 | $2,273 | $34,437 | $3,927 | $30,510 |
| 2018 | $2,238 | $34,437 | $3,927 | $30,510 |
| 2017 | $2,132 | $34,437 | $3,927 | $30,510 |
| 2016 | $2,434 | $39,473 | $4,186 | $35,287 |
| 2015 | $2,262 | $39,473 | $4,186 | $35,287 |
| 2014 | $2,256 | $39,473 | $4,186 | $35,287 |
| 2013 | $2,157 | $38,700 | $4,106 | $34,594 |
Source: Public Records
Map
Nearby Homes
- 724 Walnut St
- 701 W Wyoming Ave
- 454 Hillside Ave
- 1040 Burns Ave
- 104 Wyoming Ave
- 313 Pershing Ave
- 414 Jonte Ave
- 401 Jonte Ave
- 177 Burns Ave
- 324 Beech Ave
- 112 Bacon St
- 26 Chestnut Ave
- 1239 Springfield Pike
- 406 Williams St
- 46 Forest Ave
- 910 Byrd Ave
- 320 Reily Rd
- 115 E Mills Ave
- 435 Pearl St
- 26 W Mills Ave
Your Personal Tour Guide
Ask me questions while you tour the home.