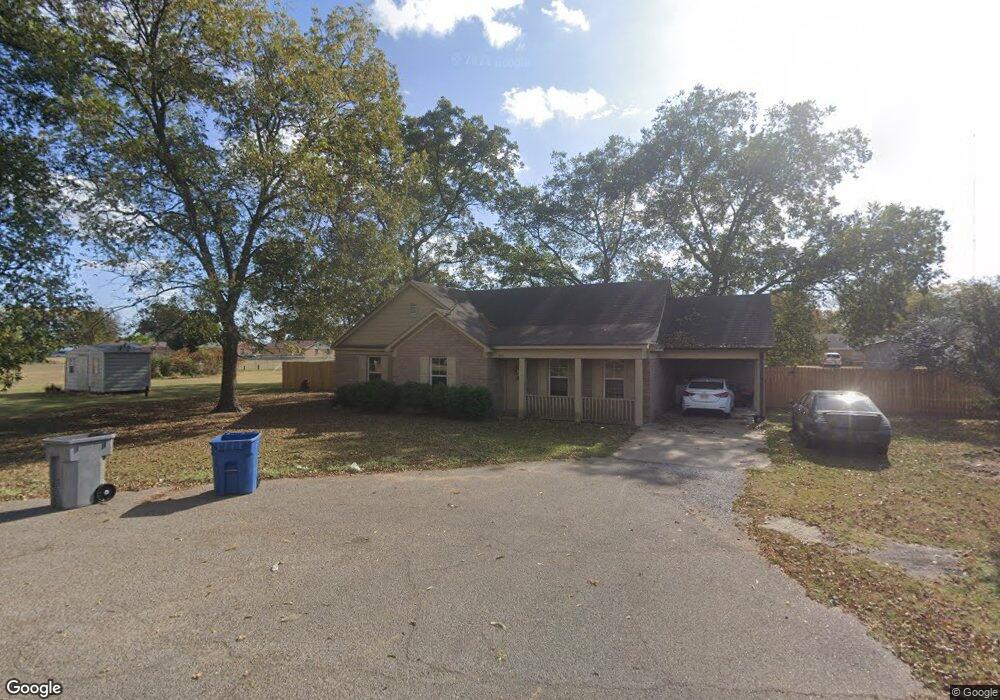
700 Scott Dr Friars Point, MS 38631
Estimated Value: $61,000 - $138,147
3
Beds
--
Bath
1,445
Sq Ft
$64/Sq Ft
Est. Value
About This Home
This home is located at 700 Scott Dr, Friars Point, MS 38631 and is currently estimated at $92,716, approximately $64 per square foot. 700 Scott Dr is a home with nearby schools including Coahoma County Junior/Senior High School.
Ownership History
Date
Name
Owned For
Owner Type
Purchase Details
Closed on
Jul 25, 2013
Sold by
Abram Antonio
Bought by
Murry Crystal N
Current Estimated Value
Home Financials for this Owner
Home Financials are based on the most recent Mortgage that was taken out on this home.
Original Mortgage
$136,424
Outstanding Balance
$106,321
Interest Rate
4.43%
Mortgage Type
USDA
Estimated Equity
-$13,605
Purchase Details
Closed on
Mar 28, 2013
Sold by
Murry Crystal N
Bought by
Abram Antonio
Purchase Details
Closed on
Mar 1, 2011
Sold by
Washington Valerie
Bought by
Murry Crystal N
Purchase Details
Closed on
Sep 2, 2008
Sold by
Collins Herman
Bought by
Washington Valerie M
Purchase Details
Closed on
Aug 30, 2005
Sold by
Randolph Lavon R and Randolph Yvonne R Aka
Bought by
Collins Herman
Purchase Details
Closed on
May 3, 2005
Sold by
Randolph Yvonne R
Bought by
Collins Herman
Create a Home Valuation Report for This Property
The Home Valuation Report is an in-depth analysis detailing your home's value as well as a comparison with similar homes in the area
Home Values in the Area
Average Home Value in this Area
Purchase History
| Date | Buyer | Sale Price | Title Company |
|---|---|---|---|
| Murry Crystal N | -- | -- | |
| Abram Antonio | -- | -- | |
| Murry Crystal N | -- | -- | |
| Washington Valerie M | -- | -- | |
| Collins Herman | -- | -- | |
| Collins Herman | -- | -- |
Source: Public Records
Mortgage History
| Date | Status | Borrower | Loan Amount |
|---|---|---|---|
| Open | Murry Crystal N | $136,424 |
Source: Public Records
Tax History Compared to Growth
Tax History
| Year | Tax Paid | Tax Assessment Tax Assessment Total Assessment is a certain percentage of the fair market value that is determined by local assessors to be the total taxable value of land and additions on the property. | Land | Improvement |
|---|---|---|---|---|
| 2025 | $1,163 | $6,543 | $500 | $6,043 |
| 2024 | $1,163 | $6,543 | $500 | $6,043 |
| 2023 | $1,141 | $6,543 | $500 | $6,043 |
| 2022 | $1,141 | $6,543 | $500 | $6,043 |
| 2021 | $1,238 | $7,104 | $500 | $6,604 |
| 2020 | $1,204 | $7,104 | $500 | $6,604 |
| 2019 | $1,176 | $7,104 | $500 | $6,604 |
| 2018 | $1,082 | $7,104 | $500 | $6,604 |
| 2017 | $0 | $7,334 | $500 | $6,834 |
| 2016 | $1,093 | $7,334 | $500 | $6,834 |
| 2015 | -- | $7,334 | $500 | $6,834 |
| 2014 | -- | $7,334 | $500 | $6,834 |
| 2013 | -- | $750 | $750 | $0 |
Source: Public Records
Map
Nearby Homes
- 17 Miller Point Rd
- 980 Moon Lake Rd
- 8 Neill Cove
- 16 Parker Lodge
- 7 Yazoo Pass Dr
- 24776 U S 61
- 4660 Moon Lake Rd
- 2466 Stovall Rd
- 0 Farrell Rd
- 278 Highway 20
- 622 Diamond Ridge Rd
- 204 Perry Dr
- 333 Westover Dr
- 340 Porter Dr
- 200 Newman Dr
- 0 Bennett Rd
- Highway 49
- 122 Center
- 9 Oak Knoll Dr
- 1152 Oakhurst Ave