700 Shady Oaks Ct Unit 26 Elgin, IL 60120
Cobblers Crossing NeighborhoodEstimated Value: $236,306 - $283,000
2
Beds
1
Bath
1,250
Sq Ft
$204/Sq Ft
Est. Value
About This Home
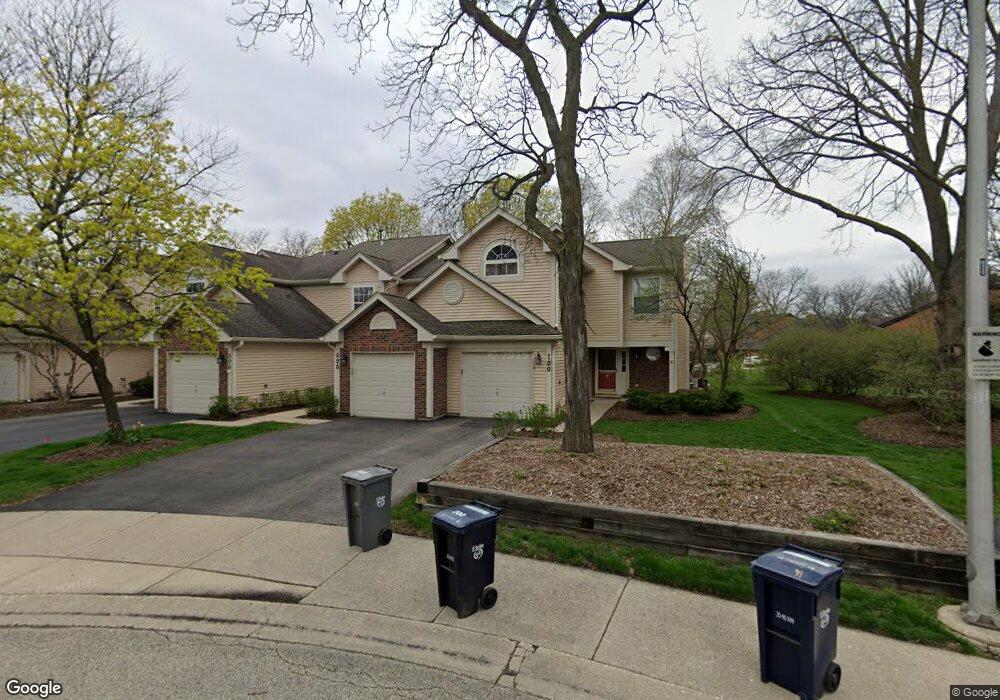
This home is located at 700 Shady Oaks Ct Unit 26, Elgin, IL 60120 and is currently estimated at $254,827, approximately $203 per square foot. 700 Shady Oaks Ct Unit 26 is a home located in Cook County with nearby schools including Lincoln Elementary School, Larsen Middle School, and Elgin High School.
Ownership History
Date
Name
Owned For
Owner Type
Purchase Details
Closed on
Oct 30, 2005
Sold by
Parente Rosa and Russo Rosa M
Bought by
Russo Gary J and Russo Rosa M
Current Estimated Value
Purchase Details
Closed on
Apr 28, 2005
Sold by
Hove Alice S
Bought by
Parente Rosa
Home Financials for this Owner
Home Financials are based on the most recent Mortgage that was taken out on this home.
Original Mortgage
$144,800
Outstanding Balance
$73,107
Interest Rate
5.75%
Mortgage Type
New Conventional
Estimated Equity
$181,720
Purchase Details
Closed on
May 18, 2001
Sold by
Vales Victoria M
Bought by
Peiffle Brian D and Sullivan Meghann M
Home Financials for this Owner
Home Financials are based on the most recent Mortgage that was taken out on this home.
Original Mortgage
$130,000
Interest Rate
7.23%
Purchase Details
Closed on
Mar 31, 1998
Sold by
Ewen Margaret R
Bought by
Vales Victoria M
Home Financials for this Owner
Home Financials are based on the most recent Mortgage that was taken out on this home.
Original Mortgage
$96,900
Interest Rate
7.19%
Create a Home Valuation Report for This Property
The Home Valuation Report is an in-depth analysis detailing your home's value as well as a comparison with similar homes in the area
Home Values in the Area
Average Home Value in this Area
Purchase History
| Date | Buyer | Sale Price | Title Company |
|---|---|---|---|
| Russo Gary J | -- | -- | |
| Parente Rosa | $181,000 | Atgf Inc | |
| Peiffle Brian D | $145,000 | -- | |
| Vales Victoria M | $114,000 | -- |
Source: Public Records
Mortgage History
| Date | Status | Borrower | Loan Amount |
|---|---|---|---|
| Open | Parente Rosa | $144,800 | |
| Previous Owner | Peiffle Brian D | $130,000 | |
| Previous Owner | Vales Victoria M | $96,900 | |
| Closed | Parente Rosa | $27,150 |
Source: Public Records
Tax History
| Year | Tax Paid | Tax Assessment Tax Assessment Total Assessment is a certain percentage of the fair market value that is determined by local assessors to be the total taxable value of land and additions on the property. | Land | Improvement |
|---|---|---|---|---|
| 2025 | $5,038 | $23,569 | $3,001 | $20,568 |
| 2024 | $5,038 | $17,506 | $2,626 | $14,880 |
| 2023 | $4,897 | $17,506 | $2,626 | $14,880 |
| 2022 | $4,897 | $17,506 | $2,626 | $14,880 |
| 2021 | $4,254 | $12,346 | $1,688 | $10,658 |
| 2020 | $4,228 | $12,346 | $1,688 | $10,658 |
| 2019 | $4,221 | $13,773 | $1,688 | $12,085 |
| 2018 | $3,821 | $11,245 | $1,500 | $9,745 |
| 2017 | $3,809 | $11,245 | $1,500 | $9,745 |
| 2016 | $3,583 | $11,245 | $1,500 | $9,745 |
| 2015 | $3,473 | $9,886 | $1,312 | $8,574 |
| 2014 | $3,364 | $9,886 | $1,312 | $8,574 |
| 2013 | $3,254 | $9,886 | $1,312 | $8,574 |
Source: Public Records
Map
Nearby Homes
- 1089 Quaker Hill Ct Unit 711
- 1154 Pegwood Dr
- 1160 Case Ln
- Vacant Lot Parcel 1 Congdon Ave
- 1139 Ironwood Ct
- 600 Countryfield Ln
- 149 Highbury Dr
- 601 Columbia Ave
- 833 Forest Ave
- 130 Stonehurst Dr
- 6085 Irene Dr
- 1590 Russell Dr
- 12N100 Berner Dr
- 6131 Canterbury Ln Unit 281
- 1254 Red Oak Ct
- 1190 Alpine Ln
- 1440 Eliot Trail
- 1812 Kelberg Ave Unit 482
- 860 Parkway Ave
- 796 Parkway Ave
- 698 Shady Oaks Ct Unit 25
- 690 Shady Oaks Ct Unit 21
- 696 Shady Oaks Ct Unit 24
- 694 Shady Oaks Ct Unit 23
- 692 Shady Oaks Ct Unit 22
- 704 Shady Oaks Ct Unit 31
- 706 Shady Oaks Ct Unit 32
- 708 Shady Oaks Ct Unit 33
- 665 Waverly Dr Unit 665D
- 665 Waverly Dr Unit 665C
- 665 Waverly Dr Unit 665A
- 665 Waverly Dr Unit 665B
- 665 Waverly Dr Unit A
- 665 Waverly Dr Unit B
- 665 Waverly Dr Unit C
- 710 Shady Oaks Ct Unit 34
- 718 Shady Oaks Ct Unit 41
- 675 Waverly Dr Unit 675C
- 675 Waverly Dr Unit 675B
- 675 Waverly Dr Unit 675D
Your Personal Tour Guide
Ask me questions while you tour the home.