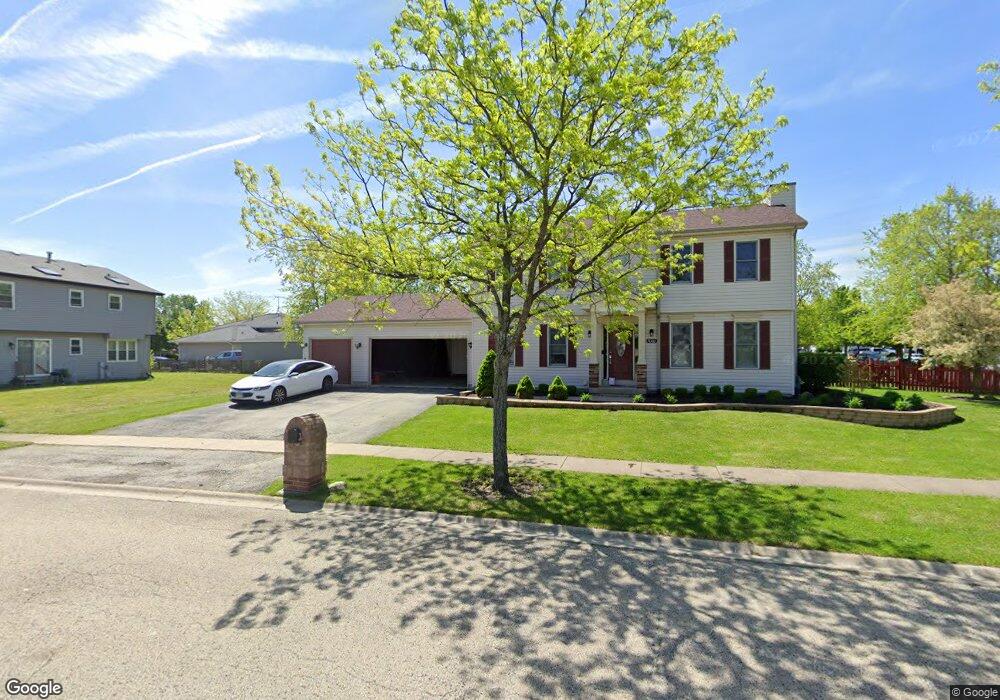
7000 Applegate Dr Plainfield, IL 60586
Fall Creek NeighborhoodEstimated Value: $350,874 - $376,000
Studio
1
Bath
1,886
Sq Ft
$191/Sq Ft
Est. Value
About This Home
This home is located at 7000 Applegate Dr, Plainfield, IL 60586 and is currently estimated at $360,969, approximately $191 per square foot. 7000 Applegate Dr is a home located in Will County with nearby schools including Thomas Jefferson Elementary School, Aux Sable Middle School, and Plainfield South High School.
Ownership History
Date
Name
Owned For
Owner Type
Purchase Details
Closed on
May 11, 2006
Sold by
The Greater Chicagoland Fellowship Club
Bought by
Flores Cynthia E
Current Estimated Value
Home Financials for this Owner
Home Financials are based on the most recent Mortgage that was taken out on this home.
Original Mortgage
$177,600
Interest Rate
9.4%
Mortgage Type
Purchase Money Mortgage
Purchase Details
Closed on
Mar 1, 2006
Sold by
Hud
Bought by
The Greater Chicagoland Fellowship Club
Home Financials for this Owner
Home Financials are based on the most recent Mortgage that was taken out on this home.
Original Mortgage
$184,000
Interest Rate
7.5%
Mortgage Type
Purchase Money Mortgage
Purchase Details
Closed on
Nov 10, 2005
Sold by
Bennett Ronald W and Washington Mutual Bank Fa
Bought by
Hud
Purchase Details
Closed on
Apr 8, 2002
Sold by
Leach Homes Inc
Bought by
Bennett Ronald W
Home Financials for this Owner
Home Financials are based on the most recent Mortgage that was taken out on this home.
Original Mortgage
$177,219
Interest Rate
7.13%
Mortgage Type
FHA
Create a Home Valuation Report for This Property
The Home Valuation Report is an in-depth analysis detailing your home's value as well as a comparison with similar homes in the area
Home Values in the Area
Average Home Value in this Area
Purchase History
| Date | Buyer | Sale Price | Title Company |
|---|---|---|---|
| Flores Cynthia E | -- | Rtc | |
| The Greater Chicagoland Fellowship Club | -- | Stewart Title Company | |
| Hud | -- | None Available | |
| Bennett Ronald W | $180,500 | Ticor Title |
Source: Public Records
Mortgage History
| Date | Status | Borrower | Loan Amount |
|---|---|---|---|
| Previous Owner | Flores Cynthia E | $177,600 | |
| Previous Owner | The Greater Chicagoland Fellowship Club | $184,000 | |
| Previous Owner | Bennett Ronald W | $177,219 |
Source: Public Records
Tax History
| Year | Tax Paid | Tax Assessment Tax Assessment Total Assessment is a certain percentage of the fair market value that is determined by local assessors to be the total taxable value of land and additions on the property. | Land | Improvement |
|---|---|---|---|---|
| 2024 | $6,546 | $99,394 | $21,940 | $77,454 |
| 2023 | $6,546 | $89,771 | $19,816 | $69,955 |
| 2022 | $5,772 | $79,504 | $17,797 | $61,707 |
| 2021 | $5,467 | $74,303 | $16,633 | $57,670 |
| 2020 | $5,381 | $72,195 | $16,161 | $56,034 |
| 2019 | $5,189 | $68,790 | $15,399 | $53,391 |
| 2018 | $4,961 | $64,632 | $14,469 | $50,163 |
| 2017 | $4,807 | $61,420 | $13,750 | $47,670 |
| 2016 | $4,704 | $58,579 | $13,114 | $45,465 |
| 2015 | $4,442 | $54,875 | $12,285 | $42,590 |
| 2014 | $4,442 | $52,937 | $11,851 | $41,086 |
| 2013 | $4,442 | $52,937 | $11,851 | $41,086 |
Source: Public Records
Map
Nearby Homes
- 1811 Cumberland Dr
- 1712 Mandan Village Dr
- 1800 Overland Dr
- 1803 Overland Dr
- 1802 Overland Dr
- 1801 Overland Dr
- 1810 Overland Dr
- 1812 Overland Dr
- 1816 Overland Dr
- 6715 Applegate Dr
- 1807 Overland Dr
- 6713 Applegate Dr
- 1806 Overland Dr
- 1616 Stanton Ln
- 6708 Buchanan Cir
- 1805 Overland Dr
- 1804 Overland Dr
- 6706 Buchanan Cir
- 6710 Buchanan Cir
- 1819 Legacy Pointe Blvd
- 1810 Mandan Village Dr
- 1815 Cumberland Dr
- 1813 Cumberland Dr
- 1808 Mandan Village Dr
- 7001 Applegate Dr
- 7004 Applegate Dr
- 1811 Mandan Village Dr
- 6913 Applegate Dr
- 7003 Applegate Dr
- 1806 Mandan Village Dr
- 1809 Mandan Village Dr
- 7005 Applegate Dr
- 1809 Cumberland Dr
- 1807 Mandan Village Dr Unit 13
- 1804 Mandan Village Dr
- 1901 Cumberland Ct
- 1812 Winger Dr
- 1903 Cumberland Ct
- 1807 Cumberland Dr
- 1810 Winger Dr
Your Personal Tour Guide
Ask me questions while you tour the home.