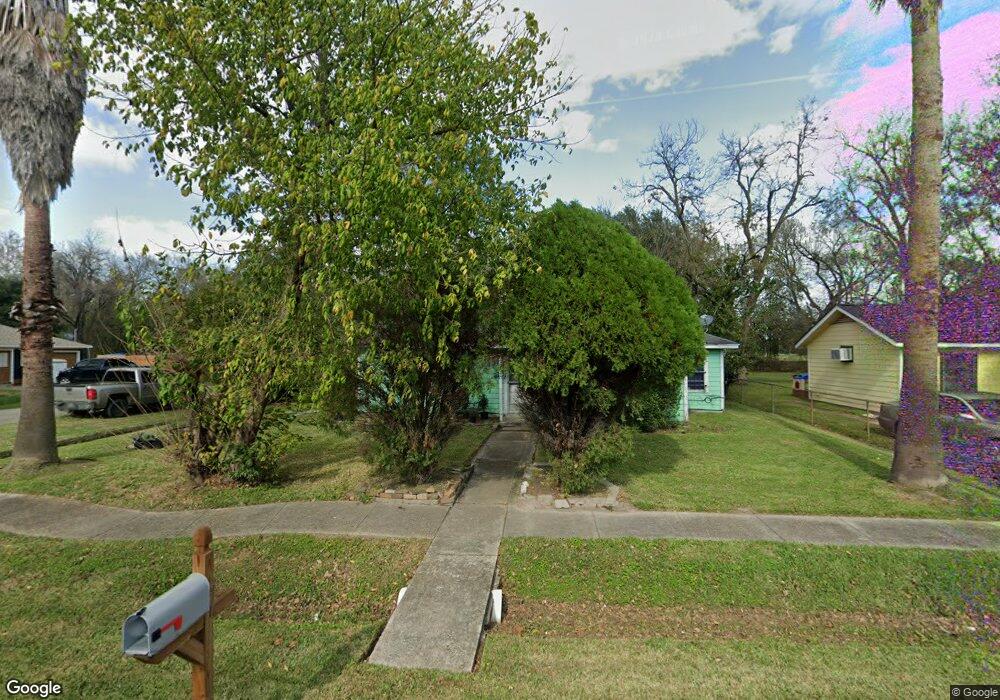
7001 Jay St Houston, TX 77028
Trinity-Houston Gardens NeighborhoodEstimated Value: $138,000 - $201,000
2
Beds
1
Bath
988
Sq Ft
$172/Sq Ft
Est. Value
About This Home
This home is located at 7001 Jay St, Houston, TX 77028 and is currently estimated at $169,672, approximately $171 per square foot. 7001 Jay St is a home located in Harris County with nearby schools including McGowen Elementary School, Key Middle, and Kashmere High School.
Ownership History
Date
Name
Owned For
Owner Type
Purchase Details
Closed on
Feb 7, 2019
Sold by
Mena Bonifacio V
Bought by
Luna Velazquez Rolando and Rubio Angel Juana
Current Estimated Value
Home Financials for this Owner
Home Financials are based on the most recent Mortgage that was taken out on this home.
Original Mortgage
$74,000
Outstanding Balance
$4,182
Interest Rate
5%
Mortgage Type
Seller Take Back
Estimated Equity
$165,490
Purchase Details
Closed on
Apr 11, 2003
Sold by
Robinson Kavin Renee and Robinson Gerald L
Bought by
Mena Bonifacio
Home Financials for this Owner
Home Financials are based on the most recent Mortgage that was taken out on this home.
Original Mortgage
$39,900
Interest Rate
5.64%
Purchase Details
Closed on
Aug 27, 1998
Sold by
Carter Kevin Renee Branch and Jackson Pearl V
Bought by
Robinson Kavin Renee
Create a Home Valuation Report for This Property
The Home Valuation Report is an in-depth analysis detailing your home's value as well as a comparison with similar homes in the area
Home Values in the Area
Average Home Value in this Area
Purchase History
| Date | Buyer | Sale Price | Title Company |
|---|---|---|---|
| Luna Velazquez Rolando | -- | None Available | |
| Mena Bonifacio | -- | Chicago Title | |
| Robinson Kavin Renee | -- | -- |
Source: Public Records
Mortgage History
| Date | Status | Borrower | Loan Amount |
|---|---|---|---|
| Open | Luna Velazquez Rolando | $74,000 | |
| Previous Owner | Mena Bonifacio | $39,900 |
Source: Public Records
Tax History Compared to Growth
Tax History
| Year | Tax Paid | Tax Assessment Tax Assessment Total Assessment is a certain percentage of the fair market value that is determined by local assessors to be the total taxable value of land and additions on the property. | Land | Improvement |
|---|---|---|---|---|
| 2025 | $2,152 | $120,264 | $70,931 | $49,333 |
| 2024 | $2,152 | $117,065 | $56,745 | $60,320 |
| 2023 | $2,152 | $85,698 | $28,373 | $57,325 |
| 2022 | $1,414 | $64,230 | $17,969 | $46,261 |
| 2021 | $1,497 | $64,230 | $17,969 | $46,261 |
| 2020 | $1,555 | $64,230 | $17,969 | $46,261 |
| 2019 | $1,492 | $58,952 | $14,512 | $44,440 |
| 2018 | $1,476 | $58,348 | $15,605 | $42,743 |
| 2017 | $1,475 | $58,348 | $15,605 | $42,743 |
| 2016 | $1,331 | $52,628 | $14,186 | $38,442 |
| 2015 | $1,398 | $52,628 | $14,186 | $38,442 |
| 2014 | $1,398 | $54,380 | $14,186 | $40,194 |
Source: Public Records
Map
Nearby Homes
- 7002 Jay St
- 6942 Peyton St
- 6701 Mariosa St
- 6520 Hoffman St
- 6713 Hoffman St
- 7204 Homestead Rd
- 5420 Lynnfield St Unit A/B
- 7406 Hoffman St
- 7306 Saint Louis St
- 5409-5417 Carey St
- 6112 Shotwell St
- 6713 Shotwell St
- 0 Kittridge
- 6909 Kittridge St
- 0 Lynnfield St
- 00 Lynnfield St
- 7337 Howton St
- 6102 Shotwell St
- 6729 Kittridge St
- 7337 Miley St