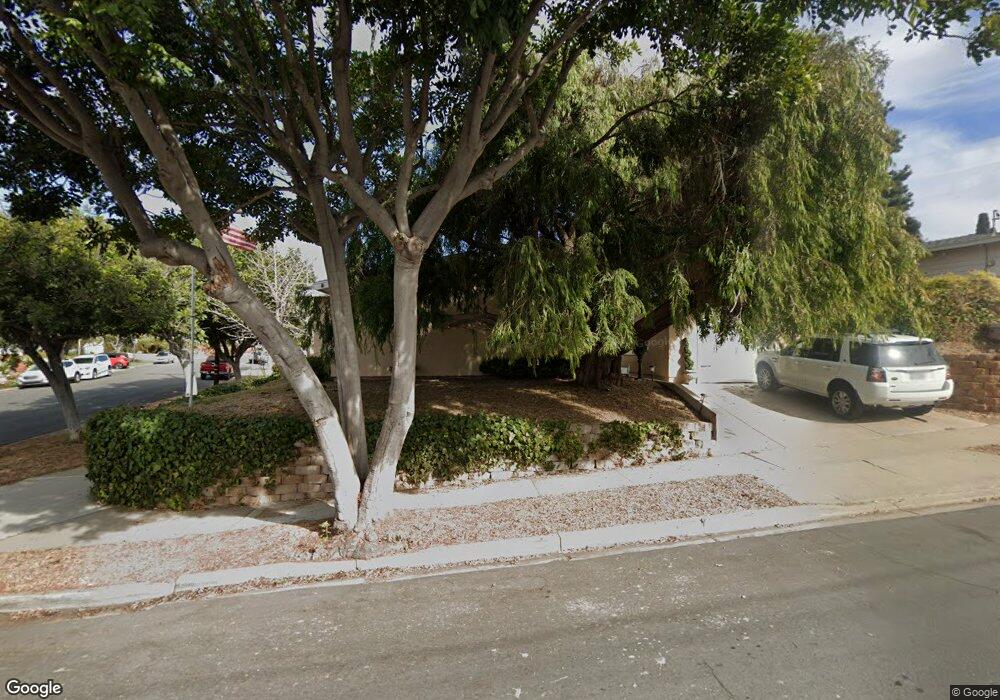
7002 Hilton Place San Diego, CA 92111
Clairemont Mesa East NeighborhoodEstimated Value: $1,078,000 - $1,201,205
4
Beds
2
Baths
2,139
Sq Ft
$531/Sq Ft
Est. Value
About This Home
This home is located at 7002 Hilton Place, San Diego, CA 92111 and is currently estimated at $1,136,051, approximately $531 per square foot. 7002 Hilton Place is a home located in San Diego County with nearby schools including Ross Elementary, Montgomery Middle School, and Kavod Charter School.
Ownership History
Date
Name
Owned For
Owner Type
Purchase Details
Closed on
Feb 16, 2016
Sold by
Balke Rick G and Balke Tommasa Sina
Bought by
Balke Rick G and Balke Tommasa Sina
Current Estimated Value
Home Financials for this Owner
Home Financials are based on the most recent Mortgage that was taken out on this home.
Original Mortgage
$478,225
Outstanding Balance
$380,239
Interest Rate
3.87%
Mortgage Type
FHA
Estimated Equity
$755,812
Purchase Details
Closed on
Feb 22, 1999
Sold by
Fontanesi John M
Bought by
Balke Rick G and Balke Sina
Home Financials for this Owner
Home Financials are based on the most recent Mortgage that was taken out on this home.
Original Mortgage
$184,764
Interest Rate
6.76%
Mortgage Type
FHA
Purchase Details
Closed on
Jun 3, 1998
Sold by
Fontanesi John M
Bought by
Fontanesi John M and Fontanesi Anne
Create a Home Valuation Report for This Property
The Home Valuation Report is an in-depth analysis detailing your home's value as well as a comparison with similar homes in the area
Home Values in the Area
Average Home Value in this Area
Purchase History
| Date | Buyer | Sale Price | Title Company |
|---|---|---|---|
| Balke Rick G | -- | Placer Title Company | |
| Balke Rick G | $186,000 | Lawyers Title | |
| Fontanesi John M | -- | -- |
Source: Public Records
Mortgage History
| Date | Status | Borrower | Loan Amount |
|---|---|---|---|
| Open | Balke Rick G | $478,225 | |
| Closed | Balke Rick G | $184,764 |
Source: Public Records
Tax History Compared to Growth
Tax History
| Year | Tax Paid | Tax Assessment Tax Assessment Total Assessment is a certain percentage of the fair market value that is determined by local assessors to be the total taxable value of land and additions on the property. | Land | Improvement |
|---|---|---|---|---|
| 2025 | $4,783 | $401,458 | $208,251 | $193,207 |
| 2024 | $4,783 | $393,587 | $204,168 | $189,419 |
| 2023 | $4,675 | $385,870 | $200,165 | $185,705 |
| 2022 | $4,549 | $378,305 | $196,241 | $182,064 |
| 2021 | $4,517 | $370,889 | $192,394 | $178,495 |
| 2020 | $4,461 | $367,087 | $190,422 | $176,665 |
| 2019 | $4,380 | $359,890 | $186,689 | $173,201 |
| 2018 | $4,095 | $352,834 | $183,029 | $169,805 |
| 2017 | $80 | $345,917 | $179,441 | $166,476 |
| 2016 | $3,930 | $339,135 | $175,923 | $163,212 |
| 2015 | $3,871 | $334,042 | $173,281 | $160,761 |
| 2014 | $3,809 | $327,499 | $169,887 | $157,612 |
Source: Public Records
Map
Nearby Homes
- 3654 Marlesta Dr
- 3662 Marlesta Dr
- 3516 Atoll St
- 7131 Malta St
- 6617 Rockglen Ave
- 7003 E Batista St
- 3413 Rollsreach Dr
- 3405 Aveley Place
- 7265 Arillo St
- 7273 Arillo St
- 3484 Armstrong St
- 3906 Mount Ainsworth Ave
- 3975 Anastasia St
- 3373 Armstrong St
- 6535 Mount Albertine Ct
- 7434 Salerno St
- 5606 Caminito Roberto
- 3781 Ashford St
- 3710 Old Cobble Rd
- 3758 Antiem St
- 7016 Hilton Place
- 7030 Hilton Place
- 3623 Marlesta Dr
- 7001 Hilton Place
- 3610 Marlesta Dr
- 7044 Hilton Place
- 7015 Hilton Place
- 3602 Marlesta Dr
- 3631 Marlesta Dr
- 3572 Marlesta Dr
- 3618 Marlesta Dr
- 7027 Astoria St
- 7058 Hilton Place
- 7041 Hilton Place
- 3565 Marlesta Dr
- 3626 Marlesta Dr
- 3568 Marlesta Dr
- 7011 Astoria St
- 3639 Marlesta Dr
- 3634 Marlesta Dr