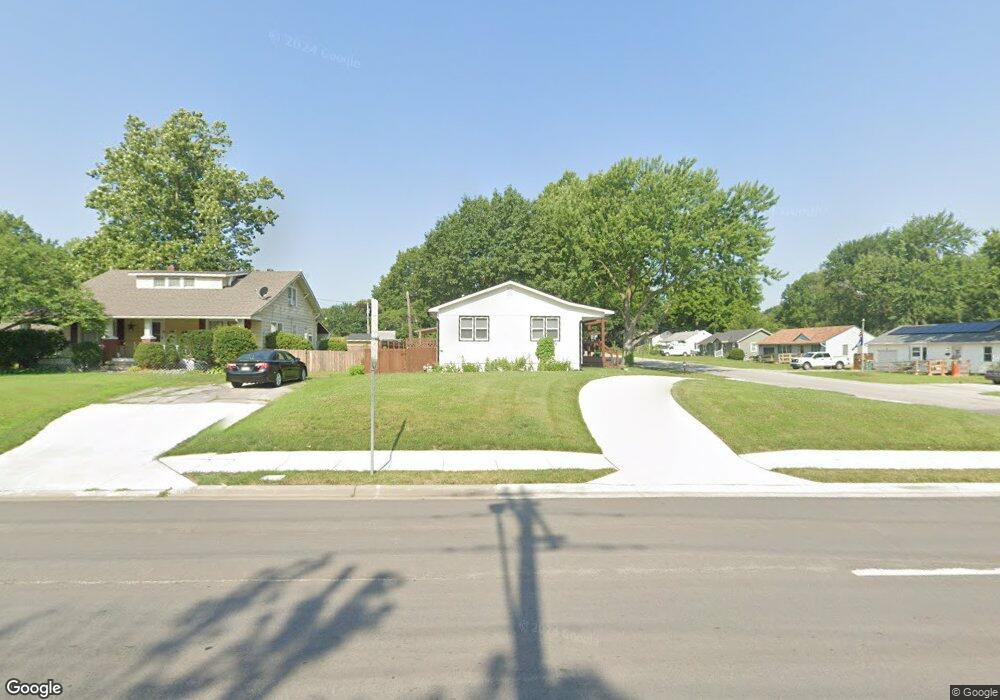
7002 Nieman Rd Shawnee, KS 66203
Estimated Value: $294,000 - $332,000
3
Beds
2
Baths
1,080
Sq Ft
$291/Sq Ft
Est. Value
About This Home
This home is located at 7002 Nieman Rd, Shawnee, KS 66203 and is currently estimated at $314,043, approximately $290 per square foot. 7002 Nieman Rd is a home located in Johnson County with nearby schools including Nieman Elementary School, Hocker Grove Middle School, and Shawnee Mission North High School.
Ownership History
Date
Name
Owned For
Owner Type
Purchase Details
Closed on
Sep 30, 2022
Sold by
Davey B Llc
Bought by
Howell Megan
Current Estimated Value
Home Financials for this Owner
Home Financials are based on the most recent Mortgage that was taken out on this home.
Original Mortgage
$330,000
Outstanding Balance
$313,091
Interest Rate
4.25%
Mortgage Type
New Conventional
Estimated Equity
$952
Purchase Details
Closed on
Sep 7, 2022
Sold by
Hills Denise T
Bought by
Davey B Llc
Home Financials for this Owner
Home Financials are based on the most recent Mortgage that was taken out on this home.
Original Mortgage
$330,000
Outstanding Balance
$313,091
Interest Rate
4.25%
Mortgage Type
New Conventional
Estimated Equity
$952
Purchase Details
Closed on
Jan 19, 2006
Sold by
Wierenga Edward V and Wierenga Debra D
Bought by
Hills Denise T
Home Financials for this Owner
Home Financials are based on the most recent Mortgage that was taken out on this home.
Original Mortgage
$106,900
Interest Rate
6.22%
Mortgage Type
New Conventional
Create a Home Valuation Report for This Property
The Home Valuation Report is an in-depth analysis detailing your home's value as well as a comparison with similar homes in the area
Home Values in the Area
Average Home Value in this Area
Purchase History
| Date | Buyer | Sale Price | Title Company |
|---|---|---|---|
| Howell Megan | -- | Security 1St Title | |
| Davey B Llc | -- | Security 1St Title | |
| Hills Denise T | -- | Midwest Title Co Inc |
Source: Public Records
Mortgage History
| Date | Status | Borrower | Loan Amount |
|---|---|---|---|
| Open | Howell Megan | $330,000 | |
| Previous Owner | Hills Denise T | $106,900 |
Source: Public Records
Tax History Compared to Growth
Tax History
| Year | Tax Paid | Tax Assessment Tax Assessment Total Assessment is a certain percentage of the fair market value that is determined by local assessors to be the total taxable value of land and additions on the property. | Land | Improvement |
|---|---|---|---|---|
| 2024 | $3,555 | $33,741 | $5,092 | $28,649 |
| 2023 | $4,069 | $37,950 | $5,092 | $32,858 |
| 2022 | $2,632 | $23,621 | $4,437 | $19,184 |
| 2021 | $2,377 | $20,654 | $3,854 | $16,800 |
| 2020 | $2,070 | $17,721 | $3,505 | $14,216 |
| 2019 | $2,096 | $17,940 | $3,190 | $14,750 |
| 2018 | $1,884 | $16,043 | $2,904 | $13,139 |
| 2017 | $1,817 | $15,226 | $2,904 | $12,322 |
| 2016 | $1,685 | $13,927 | $2,904 | $11,023 |
| 2015 | $1,568 | $13,582 | $2,904 | $10,678 |
| 2013 | -- | $12,777 | $2,904 | $9,873 |
Source: Public Records
Map
Nearby Homes
- 11217 W 69th Terrace
- 10914 W 71st St
- 11406 W 71st St
- 10902 W 71st Place
- 7107 Garnett St
- 10924 W 67th St
- 7219 Reeder St
- 11637 W 68th Terrace
- 10406 W 71st Place
- 7226 Edgewood Blvd
- 10235 W 70th St
- 10314 W 73rd St
- 10024 W 70th Terrace
- 10236 Edelweiss Cir
- 10152 Edelweiss Cir
- 9906 Edelweiss Cir
- 7410 Stearns St
- 12300 W 67th Terrace
- 6420 Ballentine St
- 6610 Halsey St
- 7030 Nieman Rd
- 11107 W 70th St
- 11104 W 70th St
- 7040 Nieman Rd
- 11108 W 70th St
- 11108 W 70th Terrace
- 11027 W 70th St
- 11112 W 70th St
- 11120 W 70th St
- 6922 Reeder Ct
- 11120 W 70th Terrace
- 11023 W 70th St
- 6918 Reeder Ct
- 11125 W 70th St
- 11103 W 69th Terrace
- 11107 W 69th Terrace
- 11126 W 70th Terrace
- 11115 W 69th Terrace
- 11019 W 70th St
- 11203 W 70th St