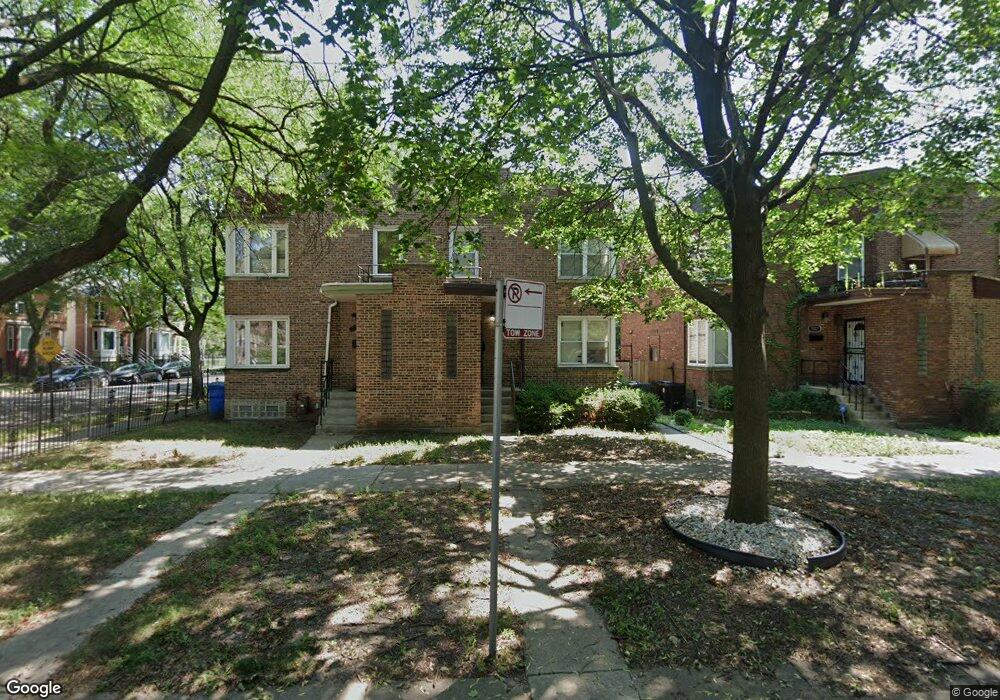
7003 S Cornell Ave Chicago, IL 60649
South Shore NeighborhoodEstimated Value: $175,909 - $201,000
2
Beds
2
Baths
1,850
Sq Ft
$101/Sq Ft
Est. Value
About This Home
This home is located at 7003 S Cornell Ave, Chicago, IL 60649 and is currently estimated at $186,727, approximately $100 per square foot. 7003 S Cornell Ave is a home located in Cook County with nearby schools including Parkside Elementary Community Academy, Hyde Park Academy High School, and Muhammad University.
Ownership History
Date
Name
Owned For
Owner Type
Purchase Details
Closed on
Aug 25, 2022
Sold by
Volynskiy Gregory
Bought by
Mcdowell Tiffany
Current Estimated Value
Home Financials for this Owner
Home Financials are based on the most recent Mortgage that was taken out on this home.
Original Mortgage
$164,900
Outstanding Balance
$157,050
Interest Rate
5.54%
Mortgage Type
New Conventional
Estimated Equity
$29,677
Purchase Details
Closed on
Jul 18, 2006
Sold by
Bank One Na
Bought by
Kalmanov Maria
Purchase Details
Closed on
Apr 21, 2006
Sold by
Bank One Na
Bought by
Bank One Na and Amortizing Residential Collateral Trust
Purchase Details
Closed on
Sep 4, 2001
Sold by
Cole Keith and Cole Juanita
Bought by
Wilds Leroy
Home Financials for this Owner
Home Financials are based on the most recent Mortgage that was taken out on this home.
Original Mortgage
$76,500
Interest Rate
11.5%
Purchase Details
Closed on
Jul 30, 2001
Sold by
Bankers Trust Company Of California Na
Bought by
Cole Keith and Cole Juanita
Home Financials for this Owner
Home Financials are based on the most recent Mortgage that was taken out on this home.
Original Mortgage
$76,500
Interest Rate
11.5%
Create a Home Valuation Report for This Property
The Home Valuation Report is an in-depth analysis detailing your home's value as well as a comparison with similar homes in the area
Home Values in the Area
Average Home Value in this Area
Purchase History
| Date | Buyer | Sale Price | Title Company |
|---|---|---|---|
| Mcdowell Tiffany | $170,000 | None Listed On Document | |
| Kalmanov Maria | $95,000 | 1St American Title | |
| Bank One Na | -- | None Available | |
| Wilds Leroy | $85,000 | 1St American Title | |
| Cole Keith | -- | -- |
Source: Public Records
Mortgage History
| Date | Status | Borrower | Loan Amount |
|---|---|---|---|
| Open | Mcdowell Tiffany | $164,900 | |
| Previous Owner | Wilds Leroy | $76,500 | |
| Closed | Wilds Leroy | $8,500 |
Source: Public Records
Tax History
| Year | Tax Paid | Tax Assessment Tax Assessment Total Assessment is a certain percentage of the fair market value that is determined by local assessors to be the total taxable value of land and additions on the property. | Land | Improvement |
|---|---|---|---|---|
| 2025 | $1,800 | $12,000 | $2,594 | $9,406 |
| 2024 | $1,800 | $12,000 | $2,594 | $9,406 |
| 2023 | $1,748 | $8,500 | $2,594 | $5,906 |
| 2022 | $1,748 | $8,500 | $2,594 | $5,906 |
| 2021 | $1,709 | $8,499 | $2,593 | $5,906 |
| 2020 | $2,142 | $9,614 | $1,867 | $7,747 |
| 2019 | $2,146 | $10,683 | $1,867 | $8,816 |
| 2018 | $2,299 | $11,640 | $1,867 | $9,773 |
| 2017 | $2,318 | $10,766 | $1,660 | $9,106 |
| 2016 | $2,156 | $10,766 | $1,660 | $9,106 |
| 2015 | $1,973 | $10,766 | $1,660 | $9,106 |
| 2014 | $1,607 | $8,661 | $1,452 | $7,209 |
| 2013 | $1,575 | $8,661 | $1,452 | $7,209 |
Source: Public Records
Map
Nearby Homes
- 7006 S East End Ave
- 1715 E 70th St
- 7821 S Stony Island Ave
- 7018 S Stony Island Ave
- 7027 S Harper Ave
- 7150-52 S Cornell Ave
- 1757 E 71st Place
- 6823 S Ridgeland Ave
- 1758 E 72nd St
- 7133 S Constance Ave
- 1524 E 72nd St
- 1464 E 69th St Unit 2N
- 1446 E 71st Place
- 7242 S East End Ave
- 1526 E 72nd Place
- 1428 E 71st Place
- 1506 E 72nd Place
- 7131 S Euclid Ave Unit 1S
- 6731 S Cregier Ave
- 1511 E 67th Place
- 7001 S Cornell Ave
- 7007 S Cornell Ave
- 7009 S Cornell Ave
- 1653 E 70th St
- 1635 E 70th St
- 1655 E 70th St
- 7100-06 S Cornell Ave
- 7015 S Cornell Ave
- 1657 E 70th St
- 1657 E 70th St
- 1646 E 70th St
- 7019 S Cornell Ave
- 1648 E 70th St
- 1642 E 70th St
- 1650 E 70th St
- 1652 E 70th St
- 1629 E 70th St
- 7010 S Cornell Ave Unit 2
- 7010 S Cornell Ave
- 7021 S Cornell Ave
Your Personal Tour Guide
Ask me questions while you tour the home.