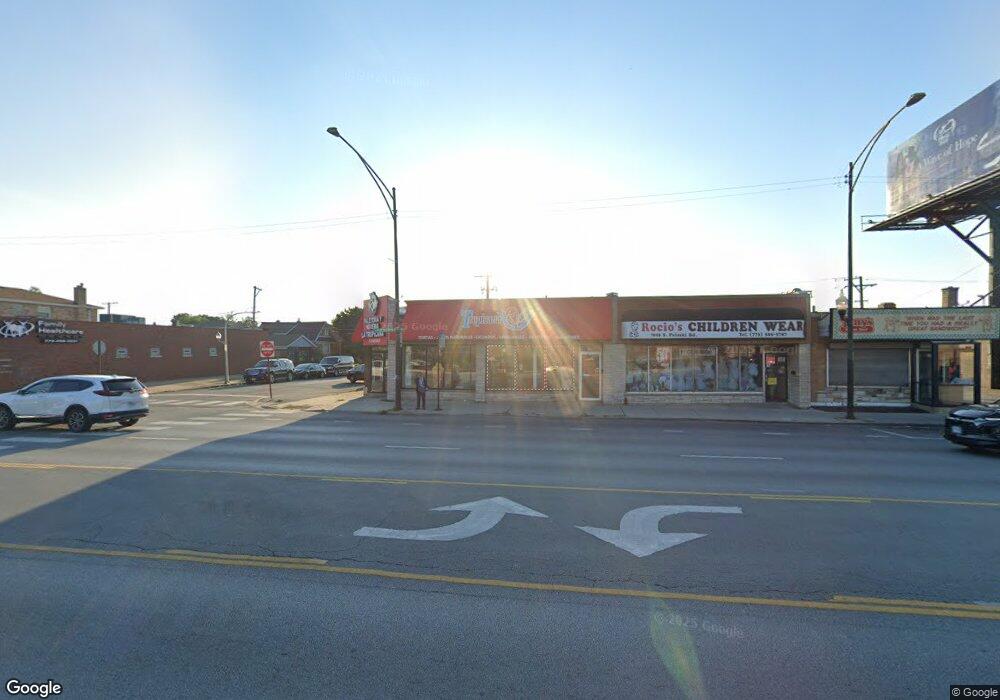
7003 S Pulaski Rd Chicago, IL 60629
West Lawn Neighborhood
Studio
--
Bath
--
Sq Ft
4,400
Sq Ft Lot
About This Home
This home is located at 7003 S Pulaski Rd, Chicago, IL 60629. 7003 S Pulaski Rd is a home located in Cook County with nearby schools including Hurley Elementary School, Bogan Computer Technical High School, and Queen Of The Universe School.
Ownership History
Date
Name
Owned For
Owner Type
Purchase Details
Closed on
Dec 6, 2023
Sold by
Magana-Diaz Miguel A and Magana-Diaz Mirian D
Bought by
Mirian D Magana And Miguel A Magana-Diaz Livi and Magana-Diaz
Purchase Details
Closed on
May 18, 2020
Sold by
Magana Felix and Magana Diaz Miguel
Bought by
Magana Diaz Miguel Angel
Purchase Details
Closed on
Jun 29, 2012
Sold by
Archer Bank
Bought by
Magana Felix and Magana Diaz Miguel Angel
Home Financials for this Owner
Home Financials are based on the most recent Mortgage that was taken out on this home.
Original Mortgage
$157,500
Interest Rate
3.64%
Mortgage Type
Seller Take Back
Purchase Details
Closed on
Jan 26, 2011
Sold by
Ramirez Evencio
Bought by
Archer Bank
Purchase Details
Closed on
Jun 29, 2005
Sold by
Piwowarczyk Walter
Bought by
Ramirez Evencio
Home Financials for this Owner
Home Financials are based on the most recent Mortgage that was taken out on this home.
Original Mortgage
$450,000
Interest Rate
7.75%
Mortgage Type
Commercial
Purchase Details
Closed on
Jan 23, 1998
Sold by
Pinnacle Bank
Bought by
Piwowarczyk Walter
Create a Home Valuation Report for This Property
The Home Valuation Report is an in-depth analysis detailing your home's value as well as a comparison with similar homes in the area
Home Values in the Area
Average Home Value in this Area
Purchase History
| Date | Buyer | Sale Price | Title Company |
|---|---|---|---|
| Mirian D Magana And Miguel A Magana-Diaz Livi | -- | None Listed On Document | |
| Magana Diaz Miguel Angel | -- | Accommodation | |
| Magana Felix | $225,000 | Cti | |
| Archer Bank | -- | None Available | |
| Ramirez Evencio | $450,000 | Ticor Title Insurance Compan | |
| Piwowarczyk Walter | $100,000 | -- |
Source: Public Records
Mortgage History
| Date | Status | Borrower | Loan Amount |
|---|---|---|---|
| Previous Owner | Magana Felix | $157,500 | |
| Previous Owner | Ramirez Evencio | $450,000 |
Source: Public Records
Tax History
| Year | Tax Paid | Tax Assessment Tax Assessment Total Assessment is a certain percentage of the fair market value that is determined by local assessors to be the total taxable value of land and additions on the property. | Land | Improvement |
|---|---|---|---|---|
| 2025 | $19,919 | $107,750 | $16,515 | $91,235 |
| 2024 | $19,919 | $107,750 | $16,515 | $91,235 |
| 2023 | $19,424 | $83,037 | $15,689 | $67,348 |
| 2022 | $19,424 | $83,037 | $15,689 | $67,348 |
| 2021 | $18,899 | $83,036 | $15,689 | $67,347 |
| 2020 | $21,886 | $86,000 | $15,689 | $70,311 |
| 2019 | $24,816 | $107,441 | $15,689 | $91,752 |
| 2018 | $24,751 | $107,441 | $15,689 | $91,752 |
| 2017 | $26,554 | $107,440 | $14,313 | $93,127 |
| 2016 | $24,724 | $107,440 | $14,313 | $93,127 |
| 2015 | $23,080 | $107,440 | $14,313 | $93,127 |
| 2014 | $22,872 | $104,373 | $14,313 | $90,060 |
| 2013 | $22,456 | $104,373 | $14,313 | $90,060 |
Source: Public Records
Map
Nearby Homes
- 3801 W 69th St
- 7125 S Hamlin Ave
- 6849 S Keeler Ave
- 6813 S Keeler Ave
- 7230 S Avers Ave
- 7205 S Hamlin Ave
- 3910 W Marquette Rd
- 3815 W Marquette Rd
- 3819 W 66th Place
- 6640 S Kedvale Ave
- 3709 W 66th Place
- 6616 S Kedvale Ave
- 7216 S Central Park Ave
- 6559 S Kedvale Ave
- 6731 S Kolin Ave
- 6815 S Kostner Ave
- 6549 S Keeler Ave
- 6724 S Kolin Ave
- 6822 S Kenneth Ave
- 3750 W 65th St
- 6959 S Pulaski Rd Unit A
- 3941 W 70th St
- 3939 W 70th St
- 7001 S Pulaski Rd
- 7001 S Pulaski Rd
- 6953 S Pulaski Rd
- 6953 S Pulaski Rd
- 6953 S Pulaski Rd Unit Basement
- 3944 W 70th St
- 3935 W 70th St
- 6949 S Pulaski Rd
- 3940 W 70th St
- 3944 W 70th Place
- 3933 W 70th St
- 3938 W 70th St
- 3940 W 70th Place
- 3940 W 70th Place
- 6945 S Pulaski Rd Unit F2
- 6945 S Pulaski Rd Unit F1
Your Personal Tour Guide
Ask me questions while you tour the home.