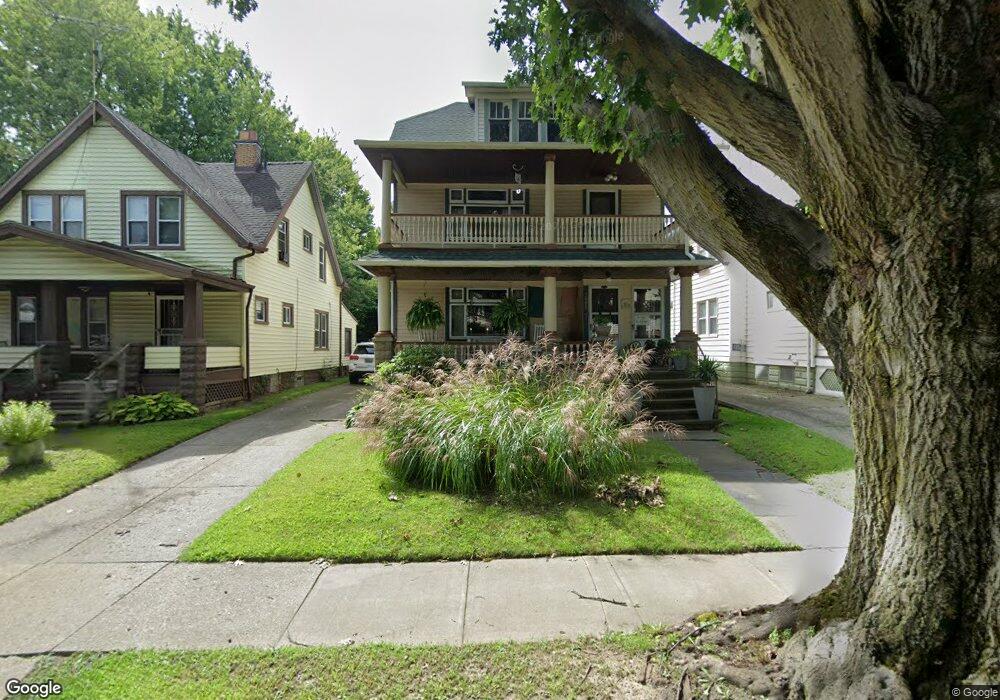
7006 Ottawa Rd Cleveland, OH 44105
Slavic Village NeighborhoodEstimated Value: $104,819 - $182,000
3
Beds
2
Baths
2,420
Sq Ft
$53/Sq Ft
Est. Value
About This Home
This home is located at 7006 Ottawa Rd, Cleveland, OH 44105 and is currently estimated at $129,205, approximately $53 per square foot. 7006 Ottawa Rd is a home located in Cuyahoga County with nearby schools including Anton Grdina School, Bolton, and Andrew J. Rickoff School.
Ownership History
Date
Name
Owned For
Owner Type
Purchase Details
Closed on
Sep 20, 2000
Sold by
Olivo Joseph D
Bought by
Curran Lisa
Current Estimated Value
Home Financials for this Owner
Home Financials are based on the most recent Mortgage that was taken out on this home.
Original Mortgage
$96,515
Outstanding Balance
$34,877
Interest Rate
7.98%
Estimated Equity
$94,328
Purchase Details
Closed on
Jul 10, 1997
Sold by
Wierzbicki Monicz
Bought by
Olivo Joseph D and Olivo Dawne
Home Financials for this Owner
Home Financials are based on the most recent Mortgage that was taken out on this home.
Original Mortgage
$70,000
Interest Rate
8%
Mortgage Type
New Conventional
Purchase Details
Closed on
Apr 3, 1990
Sold by
Ewing Rene P
Bought by
Wierzbicki Monica
Purchase Details
Closed on
Nov 17, 1989
Sold by
Wierzbicki Monica
Bought by
Ewing Rene P
Purchase Details
Closed on
Jun 9, 1988
Sold by
Wierzbicki Eleanora
Bought by
Wierzbicki Monica
Purchase Details
Closed on
Jan 1, 1975
Bought by
Wierzbicki Eleanora
Create a Home Valuation Report for This Property
The Home Valuation Report is an in-depth analysis detailing your home's value as well as a comparison with similar homes in the area
Home Values in the Area
Average Home Value in this Area
Purchase History
| Date | Buyer | Sale Price | Title Company |
|---|---|---|---|
| Curran Lisa | $99,500 | Rockwell Title Agency Inc | |
| Olivo Joseph D | $75,000 | -- | |
| Wierzbicki Monica | -- | -- | |
| Ewing Rene P | $34,000 | -- | |
| Wierzbicki Monica | -- | -- | |
| Wierzbicki Eleanora | -- | -- |
Source: Public Records
Mortgage History
| Date | Status | Borrower | Loan Amount |
|---|---|---|---|
| Open | Curran Lisa | $96,515 | |
| Previous Owner | Olivo Joseph D | $70,000 |
Source: Public Records
Tax History Compared to Growth
Tax History
| Year | Tax Paid | Tax Assessment Tax Assessment Total Assessment is a certain percentage of the fair market value that is determined by local assessors to be the total taxable value of land and additions on the property. | Land | Improvement |
|---|---|---|---|---|
| 2024 | $2,010 | $30,660 | $4,690 | $25,970 |
| 2023 | $1,431 | $18,870 | $3,260 | $15,610 |
| 2022 | $1,423 | $18,865 | $3,255 | $15,610 |
| 2021 | $1,409 | $18,870 | $3,260 | $15,610 |
| 2020 | $1,430 | $16,560 | $2,870 | $13,690 |
| 2019 | $1,322 | $47,300 | $8,200 | $39,100 |
| 2018 | $1,318 | $16,560 | $2,870 | $13,690 |
| 2017 | $1,259 | $15,270 | $1,860 | $13,410 |
| 2016 | $1,249 | $15,270 | $1,860 | $13,410 |
| 2015 | $1,254 | $15,270 | $1,860 | $13,410 |
| 2014 | $1,254 | $15,270 | $1,860 | $13,410 |
Source: Public Records
Map
Nearby Homes
- 3971 E 71st St
- 6917 Worley Ave
- 3952 E 74th St
- 7304 Worley Ave
- 6714 Ottawa Rd
- 6618 Collier Ave
- 4067 E 68th St
- 4092 E 72nd St
- 7509 Indiana Ave
- 6920 Hosmer Ave
- 7505 Ottawa Rd
- 7528 Ottawa Rd
- 6703 Claasen Ave
- 7605 Ottawa Rd
- 7623 Dercum Rd
- 6727 Clement Ave
- 7738 Spafford Rd
- 7213 Park Ave
- 6710 Clement Ave
- 7418 Clement Ave
- 7002 Ottawa Rd
- 7010 Ottawa Rd
- 6932 Ottawa Rd
- 6928 Ottawa Rd
- 3972 E 71st St
- 3980 E 71st St
- 6924 Ottawa Rd
- 7005 Indiana Ave
- 7001 Indiana Ave
- 7009 Indiana Ave
- 3968 E 71st St
- 6931 Indiana Ave
- 3984 E 71st St
- 6920 Ottawa Rd
- 6927 Indiana Ave
- 7005 Ottawa Rd
- 7001 Ottawa Rd
- 3964 E 71st St
- 7009 Ottawa Rd
- 6933 Ottawa Rd