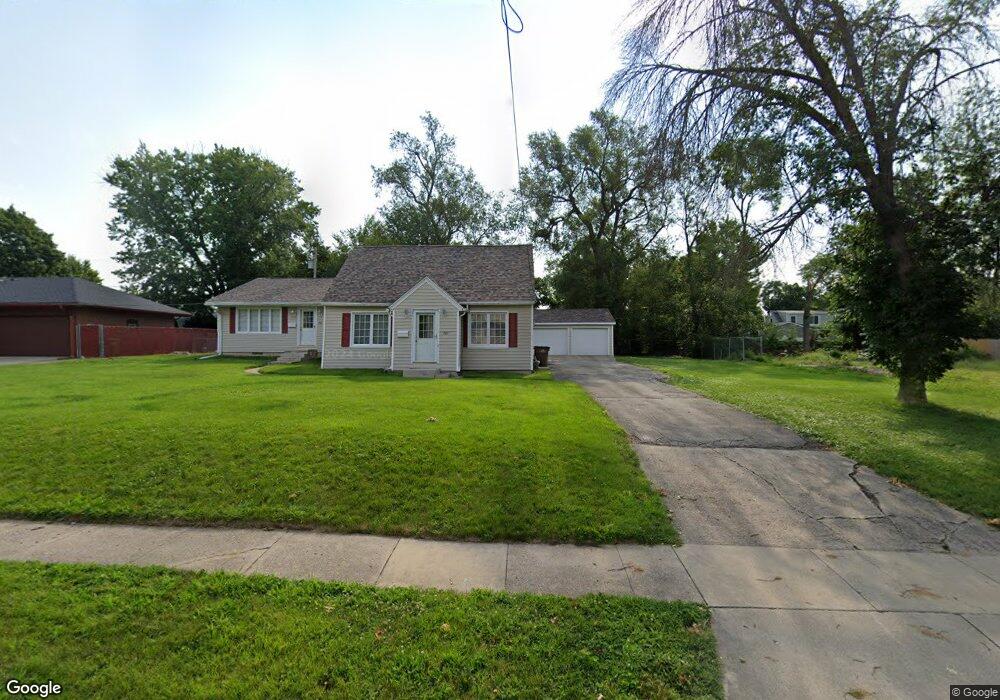
701 12th St West Des Moines, IA 50265
Estimated Value: $285,491 - $292,000
4
Beds
3
Baths
2,013
Sq Ft
$144/Sq Ft
Est. Value
About This Home
This home is located at 701 12th St, West Des Moines, IA 50265 and is currently estimated at $289,873, approximately $144 per square foot. 701 12th St is a home located in Polk County with nearby schools including Hillside Elementary School, Stilwell Junior High School, and Valley Southwoods Freshman High School.
Ownership History
Date
Name
Owned For
Owner Type
Purchase Details
Closed on
May 27, 2009
Sold by
Manning Genald L and Manning Beth H
Bought by
Manning Real Estate Llc
Current Estimated Value
Purchase Details
Closed on
Jul 16, 2002
Sold by
Lackey Robert K
Bought by
Manning Gerald L
Purchase Details
Closed on
Dec 3, 1992
Sold by
Dye Violet Irene
Bought by
Lackey Robert K
Create a Home Valuation Report for This Property
The Home Valuation Report is an in-depth analysis detailing your home's value as well as a comparison with similar homes in the area
Home Values in the Area
Average Home Value in this Area
Purchase History
| Date | Buyer | Sale Price | Title Company |
|---|---|---|---|
| Manning Real Estate Llc | -- | None Available | |
| Manning Gerald L | $85,000 | -- | |
| Lackey Robert K | -- | -- |
Source: Public Records
Tax History Compared to Growth
Tax History
| Year | Tax Paid | Tax Assessment Tax Assessment Total Assessment is a certain percentage of the fair market value that is determined by local assessors to be the total taxable value of land and additions on the property. | Land | Improvement |
|---|---|---|---|---|
| 2025 | $3,754 | $256,600 | $86,800 | $169,800 |
| 2024 | $3,754 | $236,900 | $79,000 | $157,900 |
| 2023 | $3,762 | $236,900 | $79,000 | $157,900 |
| 2022 | $3,718 | $194,800 | $68,200 | $126,600 |
| 2021 | $3,576 | $194,800 | $68,200 | $126,600 |
| 2020 | $3,522 | $178,300 | $62,000 | $116,300 |
| 2019 | $3,264 | $178,300 | $62,000 | $116,300 |
| 2018 | $3,270 | $159,300 | $54,300 | $105,000 |
| 2017 | $3,136 | $159,300 | $54,300 | $105,000 |
| 2016 | $3,068 | $148,400 | $49,800 | $98,600 |
| 2015 | $3,068 | $148,400 | $49,800 | $98,600 |
| 2014 | $2,932 | $140,200 | $46,100 | $94,100 |
Source: Public Records
Map
Nearby Homes