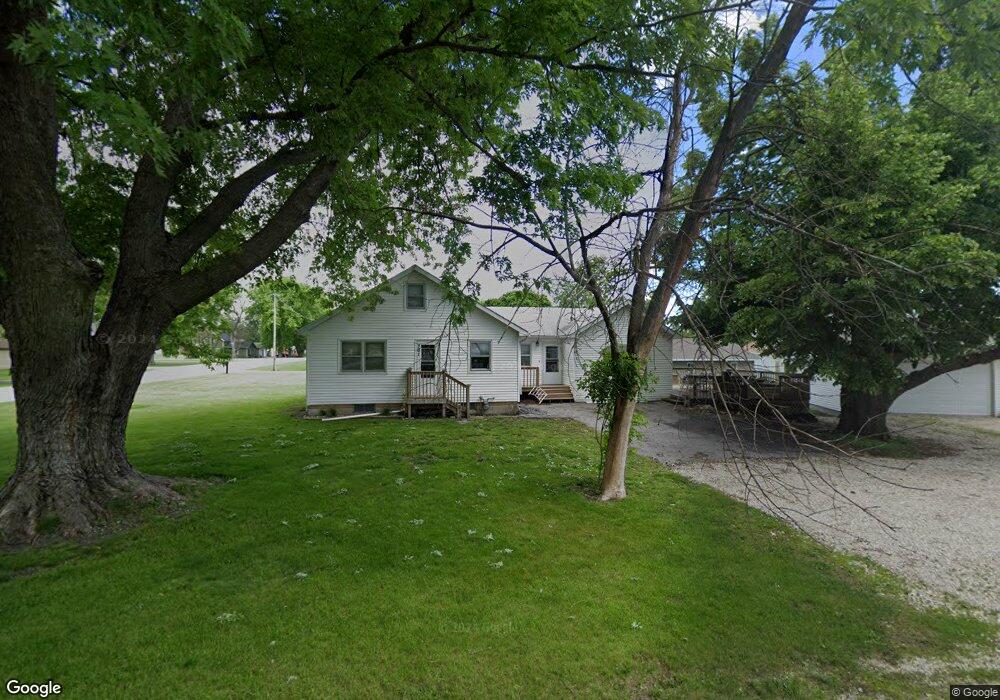
701 Allen St Duncombe, IA 50532
Estimated Value: $118,000 - $272,000
3
Beds
1
Bath
1,677
Sq Ft
$101/Sq Ft
Est. Value
About This Home
This home is located at 701 Allen St, Duncombe, IA 50532 and is currently estimated at $168,771, approximately $100 per square foot. 701 Allen St is a home with nearby schools including Pleasant View Elementary School, Northeast Hamilton Elementary School, and Sunset Heights Elementary School.
Ownership History
Date
Name
Owned For
Owner Type
Purchase Details
Closed on
May 25, 2011
Sold by
Ball Ruth L
Bought by
Geis Debra J
Current Estimated Value
Purchase Details
Closed on
Nov 9, 2009
Sold by
Ball Ruth L and Willardson Janice
Bought by
Ball Ruth L
Home Financials for this Owner
Home Financials are based on the most recent Mortgage that was taken out on this home.
Original Mortgage
$108,000
Interest Rate
2.74%
Mortgage Type
Stand Alone Refi Refinance Of Original Loan
Create a Home Valuation Report for This Property
The Home Valuation Report is an in-depth analysis detailing your home's value as well as a comparison with similar homes in the area
Home Values in the Area
Average Home Value in this Area
Purchase History
| Date | Buyer | Sale Price | Title Company |
|---|---|---|---|
| Geis Debra J | $60,500 | None Available | |
| Ball Ruth L | -- | None Available |
Source: Public Records
Mortgage History
| Date | Status | Borrower | Loan Amount |
|---|---|---|---|
| Previous Owner | Ball Ruth L | $108,000 |
Source: Public Records
Tax History Compared to Growth
Tax History
| Year | Tax Paid | Tax Assessment Tax Assessment Total Assessment is a certain percentage of the fair market value that is determined by local assessors to be the total taxable value of land and additions on the property. | Land | Improvement |
|---|---|---|---|---|
| 2025 | $1,714 | $119,820 | $5,850 | $113,970 |
| 2024 | $1,714 | $113,420 | $5,850 | $107,570 |
| 2023 | $1,690 | $113,420 | $5,850 | $107,570 |
| 2022 | $1,648 | $100,330 | $5,850 | $94,480 |
| 2021 | $1,572 | $100,330 | $5,850 | $94,480 |
| 2020 | $1,572 | $92,950 | $5,850 | $87,100 |
| 2019 | $1,702 | $101,480 | $6,440 | $95,040 |
| 2018 | $1,813 | $92,250 | $5,850 | $86,400 |
| 2017 | $1,754 | $87,230 | $0 | $0 |
| 2016 | $1,762 | $87,230 | $0 | $0 |
| 2015 | $1,762 | $87,230 | $0 | $0 |
| 2014 | $1,764 | $87,230 | $0 | $0 |
Source: Public Records
Map
Nearby Homes