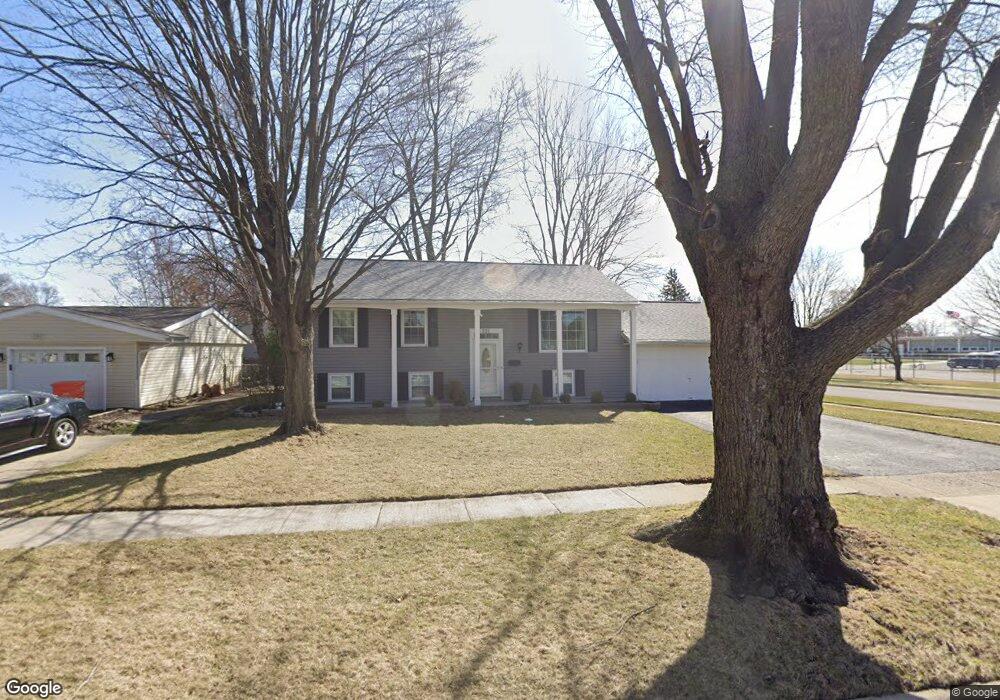
701 Cynthia Ct Findlay, OH 45840
Estimated Value: $198,000 - $250,000
4
Beds
2
Baths
1,700
Sq Ft
$132/Sq Ft
Est. Value
About This Home
This home is located at 701 Cynthia Ct, Findlay, OH 45840 and is currently estimated at $225,207, approximately $132 per square foot. 701 Cynthia Ct is a home located in Hancock County with nearby schools including Whittier Primary School, Bigelow Hill Elementary School, and Glenwood Middle School.
Ownership History
Date
Name
Owned For
Owner Type
Purchase Details
Closed on
Mar 1, 2017
Sold by
Dunten Darwin P and Dunten Polly J
Bought by
Downing Charles P and Downing Tiffany L
Current Estimated Value
Home Financials for this Owner
Home Financials are based on the most recent Mortgage that was taken out on this home.
Original Mortgage
$132,900
Outstanding Balance
$109,962
Interest Rate
4.09%
Mortgage Type
New Conventional
Estimated Equity
$115,245
Purchase Details
Closed on
Oct 3, 2000
Sold by
Benjamin William F
Bought by
Dunten Darwin P and Dunten Polly J
Home Financials for this Owner
Home Financials are based on the most recent Mortgage that was taken out on this home.
Original Mortgage
$94,300
Interest Rate
7.98%
Mortgage Type
New Conventional
Purchase Details
Closed on
May 23, 1990
Bought by
Benjamin Wm Floyd and Benjamin Lori M
Purchase Details
Closed on
Apr 14, 1983
Bought by
Ruhl Neil R
Create a Home Valuation Report for This Property
The Home Valuation Report is an in-depth analysis detailing your home's value as well as a comparison with similar homes in the area
Home Values in the Area
Average Home Value in this Area
Purchase History
| Date | Buyer | Sale Price | Title Company |
|---|---|---|---|
| Downing Charles P | $142,900 | Mid Am Title | |
| Dunten Darwin P | $117,900 | -- | |
| Benjamin Wm Floyd | $70,000 | -- | |
| Ruhl Neil R | $49,900 | -- |
Source: Public Records
Mortgage History
| Date | Status | Borrower | Loan Amount |
|---|---|---|---|
| Open | Downing Charles P | $132,900 | |
| Closed | Dunten Darwin P | $94,300 |
Source: Public Records
Tax History Compared to Growth
Tax History
| Year | Tax Paid | Tax Assessment Tax Assessment Total Assessment is a certain percentage of the fair market value that is determined by local assessors to be the total taxable value of land and additions on the property. | Land | Improvement |
|---|---|---|---|---|
| 2024 | $1,857 | $52,270 | $7,920 | $44,350 |
| 2023 | $1,860 | $52,270 | $7,920 | $44,350 |
| 2022 | $1,853 | $52,270 | $7,920 | $44,350 |
| 2021 | $1,817 | $44,640 | $7,920 | $36,720 |
| 2020 | $1,817 | $44,640 | $7,920 | $36,720 |
| 2019 | $1,780 | $44,640 | $7,920 | $36,720 |
| 2018 | $1,687 | $38,820 | $6,890 | $31,930 |
| 2017 | $1,688 | $38,820 | $6,890 | $31,930 |
| 2016 | $1,668 | $38,820 | $6,890 | $31,930 |
| 2015 | $1,612 | $36,870 | $6,890 | $29,980 |
| 2014 | $1,612 | $36,870 | $6,890 | $29,980 |
| 2012 | $1,654 | $37,550 | $6,890 | $30,660 |
Source: Public Records
Map
Nearby Homes
- 715 Christina Ct
- 1908 Gayle Ln
- 420 Allen Ave
- 600 Charles Ave
- 1010 Brenda Ct
- 1062 Vincent St
- 0 Sheridan Ave
- 716 Winfield Ave
- 230 Midland Ave
- 1825 Pershing St
- 1865 Breckenridge Rd
- 206 Midland Ave
- 1736 Woodridge Crescent
- 2100 Candlewick Dr
- 1216 Concord Ct
- 1820 N Main St
- 1928 Deer Ridge Dr
- 1928 Deer Ridge Dr Unit L-133
- 115 George St
- 1474 Southwood Ave
- 707 Cynthia Ct
- 700 Christina Ct
- 713 Cynthia Ct
- 708 Christina Ct
- 700 Cynthia Ct
- 719 Cynthia Ct
- 706 Cynthia Ct
- 716 Christina Ct
- 712 Cynthia Ct
- 725 Cynthia Ct
- 718 Cynthia Ct
- 722 Christina Ct
- 701 Lesa Ave
- 1501 Glenwood St
- 724 Cynthia Ct
- 707 Lesa Ave
- 707 Christina Ct
- 713 Lesa Ave
- 731 Cynthia Ct
- 723 Christina Ct