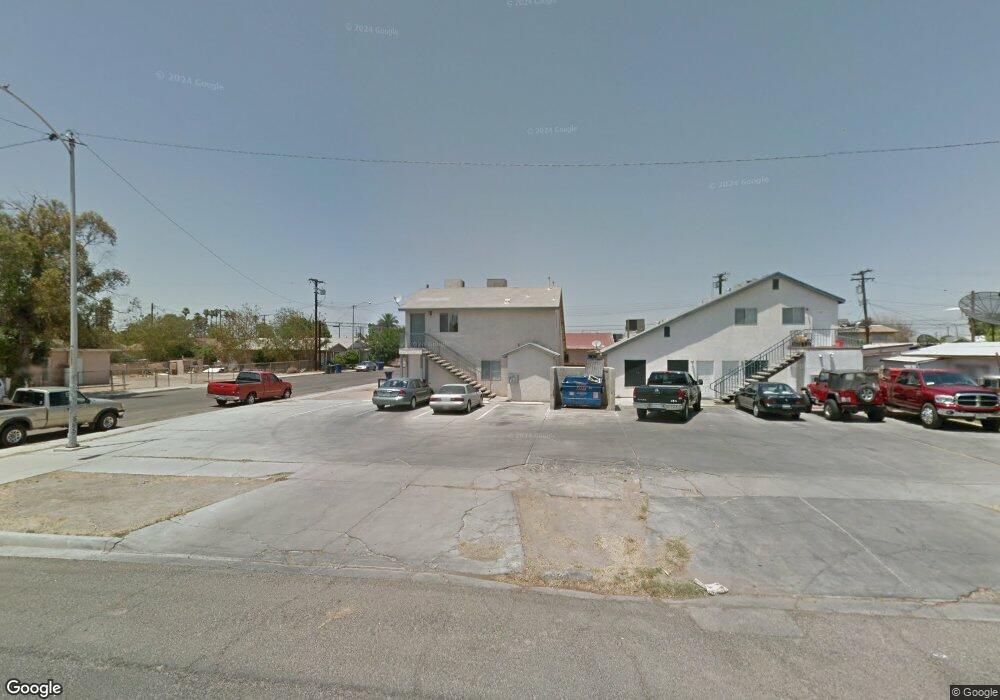
701 E 3rd St Calexico, CA 92231
Estimated Value: $429,000 - $676,000
Studio
--
Bath
2,250
Sq Ft
$232/Sq Ft
Est. Value
About This Home
This home is located at 701 E 3rd St, Calexico, CA 92231 and is currently estimated at $521,667, approximately $231 per square foot. 701 E 3rd St is a home located in Imperial County with nearby schools including Dool Elementary School, Enrique Camarena Junior High School, and Calexico High School.
Ownership History
Date
Name
Owned For
Owner Type
Purchase Details
Closed on
Feb 2, 2024
Sold by
Sarabia Cesar and Boisson Andrea
Bought by
Sarabia Cesar
Current Estimated Value
Purchase Details
Closed on
Oct 7, 1998
Sold by
Sarabia Cesar
Bought by
Sarabia Cesar and Sarabia Andrea
Home Financials for this Owner
Home Financials are based on the most recent Mortgage that was taken out on this home.
Original Mortgage
$123,500
Interest Rate
6.6%
Mortgage Type
Commercial
Purchase Details
Closed on
Jun 19, 1998
Sold by
Sarabia Severiano and Sarabia S
Bought by
Sarabia Cesar
Purchase Details
Closed on
Oct 27, 1997
Sold by
Sarabia Severiano
Bought by
Sarabia Cesar and Sveriano Sarabia
Create a Home Valuation Report for This Property
The Home Valuation Report is an in-depth analysis detailing your home's value as well as a comparison with similar homes in the area
Purchase History
| Date | Buyer | Sale Price | Title Company |
|---|---|---|---|
| Sarabia Cesar | -- | None Listed On Document | |
| Sarabia Cesar | -- | Commonwealth Land Title Ins | |
| Sarabia Cesar | -- | -- | |
| Sarabia Cesar | $30,000 | -- |
Source: Public Records
Mortgage History
| Date | Status | Borrower | Loan Amount |
|---|---|---|---|
| Previous Owner | Sarabia Cesar | $123,500 | |
| Closed | Sarabia Cesar | $19,000 |
Source: Public Records
Tax History
| Year | Tax Paid | Tax Assessment Tax Assessment Total Assessment is a certain percentage of the fair market value that is determined by local assessors to be the total taxable value of land and additions on the property. | Land | Improvement |
|---|---|---|---|---|
| 2025 | $3,161 | $260,306 | $57,465 | $202,841 |
| 2023 | $3,161 | $250,200 | $55,235 | $194,965 |
| 2022 | $3,062 | $245,295 | $54,152 | $191,143 |
| 2021 | $2,971 | $240,487 | $53,091 | $187,396 |
| 2020 | $2,862 | $238,022 | $52,547 | $185,475 |
| 2019 | $2,779 | $233,356 | $51,517 | $181,839 |
| 2018 | $2,754 | $228,781 | $50,507 | $178,274 |
| 2017 | $2,554 | $224,296 | $49,517 | $174,779 |
| 2016 | $2,437 | $219,899 | $48,547 | $171,352 |
| 2015 | $2,394 | $216,597 | $47,818 | $168,779 |
| 2014 | $2,338 | $212,355 | $46,882 | $165,473 |
Source: Public Records
Map
Nearby Homes
- 618 E 5th St Unit B
- 618 E 5th St Unit A-B
- 510 E 3rd St
- 737 Renaud Ct
- 419 E 3rd St
- 415 E 3rd St
- 810 E 6th St
- 817 E 6th St
- 700 Blair Ave
- 941 E 1st St
- 1013 E 2nd St
- 201 E Sherman St
- 631 Paulin Ave
- 816 Beach Ave
- 21 E 7th St
- 21 E 7th St Unit 1
- 711 N Preston Dr
- 1070 Heber Ave
- 1061 Heber Ave
- 0 California 98
Your Personal Tour Guide
Ask me questions while you tour the home.