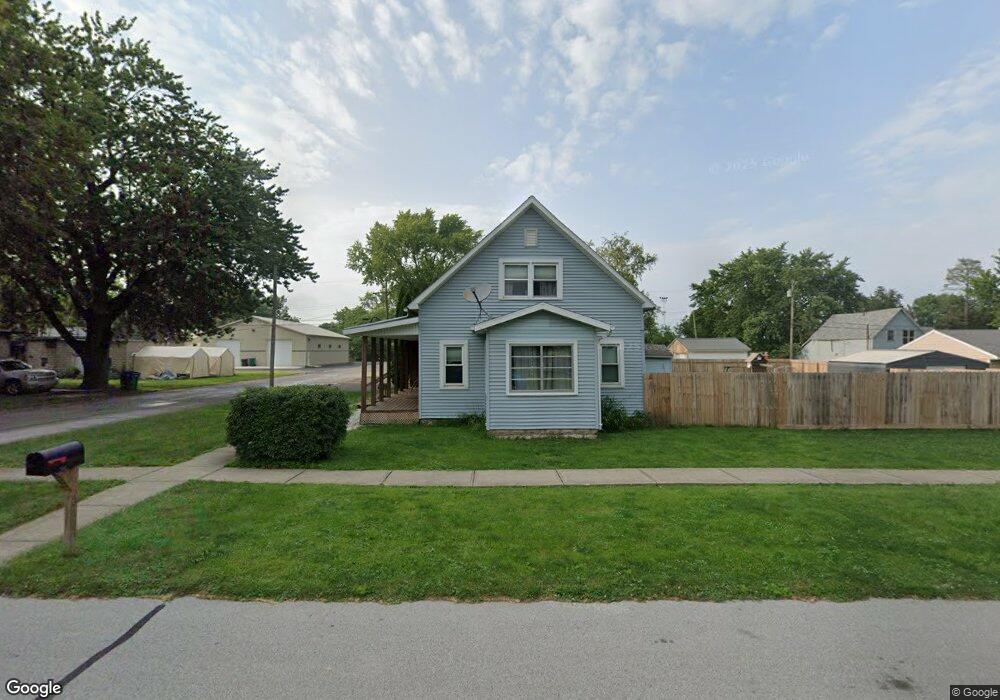
701 E 3rd St Fowler, IN 47944
Estimated Value: $182,000 - $222,000
3
Beds
2
Baths
1,757
Sq Ft
$115/Sq Ft
Est. Value
About This Home
This home is located at 701 E 3rd St, Fowler, IN 47944 and is currently estimated at $201,952, approximately $114 per square foot. 701 E 3rd St is a home located in Benton County with nearby schools including Benton Central Junior/Senior High School and Sacred Heart Elementary School.
Ownership History
Date
Name
Owned For
Owner Type
Purchase Details
Closed on
Jan 28, 2013
Sold by
Logsdon Russell L
Bought by
Bohlinger Clayton P and Bohlinger Courtney N
Current Estimated Value
Purchase Details
Closed on
Feb 27, 1998
Sold by
Not Provided
Bought by
Not Provided
Create a Home Valuation Report for This Property
The Home Valuation Report is an in-depth analysis detailing your home's value as well as a comparison with similar homes in the area
Purchase History
| Date | Buyer | Sale Price | Title Company |
|---|---|---|---|
| Bohlinger Clayton P | $65,500 | -- | |
| Not Provided | $49,000 | -- |
Source: Public Records
Tax History
| Year | Tax Paid | Tax Assessment Tax Assessment Total Assessment is a certain percentage of the fair market value that is determined by local assessors to be the total taxable value of land and additions on the property. | Land | Improvement |
|---|---|---|---|---|
| 2025 | $1,837 | $163,600 | $16,300 | $147,300 |
| 2024 | $1,837 | $163,800 | $16,300 | $147,500 |
| 2023 | $1,653 | $146,900 | $8,700 | $138,200 |
| 2022 | $1,211 | $110,200 | $8,700 | $101,500 |
| 2021 | $901 | $90,900 | $8,700 | $82,200 |
| 2020 | $639 | $79,500 | $8,700 | $70,800 |
| 2019 | $695 | $85,100 | $8,700 | $76,400 |
| 2018 | $381 | $75,500 | $8,700 | $66,800 |
| 2017 | $502 | $74,500 | $8,700 | $65,800 |
| 2016 | $474 | $68,100 | $8,700 | $59,400 |
| 2014 | $418 | $60,300 | $7,800 | $52,500 |
| 2013 | $418 | $56,900 | $7,400 | $49,500 |
Source: Public Records
Map
Nearby Homes
- 305 N Lincoln Ave
- 601 E 3rd St
- 303 N Jackson Ave
- 502 E 5th St
- 202 N Van Buren Ave
- 307 N Madison Ave
- 201 S Grant Ave
- 1009 E 4th St
- 501 E 7th St
- 503 E 8th St
- 310 E 7th St
- 909 E 8th St
- 307 N Washington Ave
- 902 E 8th St
- 206 E Maple St
- 705 N Adams Ave
- 111 W 4th St
- 703 W 2nd St
- Lot 9 W 2nd St
- 665 W 2nd St
Your Personal Tour Guide
Ask me questions while you tour the home.