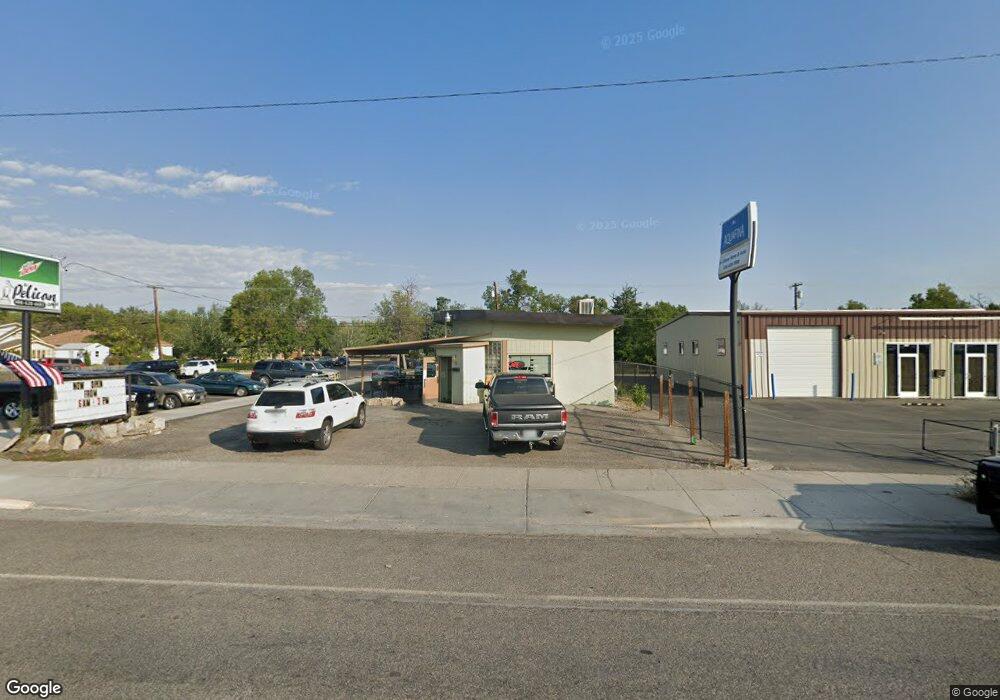
701 E Main St Laurel, MT 59044
Studio
--
Bath
960
Sq Ft
7,797
Sq Ft Lot
About This Home
This home is located at 701 E Main St, Laurel, MT 59044. 701 E Main St is a home located in Yellowstone County with nearby schools including Fred W. Graff School, West School, and Laurel Middle School.
Ownership History
Date
Name
Owned For
Owner Type
Purchase Details
Closed on
May 22, 2015
Sold by
Desjarlais Tacy and Schuchard Tacy
Bought by
Page Chad E
Home Financials for this Owner
Home Financials are based on the most recent Mortgage that was taken out on this home.
Original Mortgage
$85,000
Interest Rate
3.63%
Mortgage Type
Future Advance Clause Open End Mortgage
Purchase Details
Closed on
Jul 3, 2010
Sold by
Desjarlais Dion
Bought by
Desjarlais Tacy
Purchase Details
Closed on
Nov 20, 2007
Sold by
Hinz Shawn M and Hinz Shawn
Bought by
Desjarlais Dion and Desjarlais Tacy
Home Financials for this Owner
Home Financials are based on the most recent Mortgage that was taken out on this home.
Original Mortgage
$133,000
Interest Rate
6.38%
Mortgage Type
Commercial
Purchase Details
Closed on
Nov 12, 2007
Sold by
Hinz Shanna and Hinz Shayne
Bought by
Hinz Shawn
Home Financials for this Owner
Home Financials are based on the most recent Mortgage that was taken out on this home.
Original Mortgage
$133,000
Interest Rate
6.38%
Mortgage Type
Commercial
Create a Home Valuation Report for This Property
The Home Valuation Report is an in-depth analysis detailing your home's value as well as a comparison with similar homes in the area
Home Values in the Area
Average Home Value in this Area
Purchase History
| Date | Buyer | Sale Price | Title Company |
|---|---|---|---|
| Page Chad E | -- | First Montana Title | |
| Desjarlais Tacy | -- | None Available | |
| Desjarlais Dion | -- | None Available | |
| Hinz Shawn | -- | None Available |
Source: Public Records
Mortgage History
| Date | Status | Borrower | Loan Amount |
|---|---|---|---|
| Closed | Page Chad E | $85,000 | |
| Previous Owner | Desjarlais Dion | $133,000 |
Source: Public Records
Tax History
| Year | Tax Paid | Tax Assessment Tax Assessment Total Assessment is a certain percentage of the fair market value that is determined by local assessors to be the total taxable value of land and additions on the property. | Land | Improvement |
|---|---|---|---|---|
| 2025 | $2,101 | $155,300 | $79,023 | $76,277 |
| 2024 | $2,101 | $137,800 | $53,318 | $84,482 |
| 2023 | $1,953 | $137,800 | $53,318 | $84,482 |
| 2022 | $1,202 | $102,900 | $0 | $0 |
| 2021 | $1,619 | $102,900 | $0 | $0 |
| 2020 | $1,422 | $93,900 | $0 | $0 |
| 2019 | $1,535 | $93,900 | $0 | $0 |
| 2018 | $1,641 | $100,400 | $0 | $0 |
| 2017 | $1,549 | $100,400 | $0 | $0 |
| 2016 | $1,481 | $96,900 | $0 | $0 |
| 2015 | $3,689 | $96,900 | $0 | $0 |
| 2014 | -- | $60,524 | $0 | $0 |
Source: Public Records
Map
Nearby Homes
- 801 E 4th St
- 601 E 5th St
- 717 E 5th St
- 717 E 5th, 506 Alder Ave
- 414 Wyoming Ave
- 516 Pennsylvania Ave
- 605 Date Ave
- 110 E 5th St
- 1104 E 8th St
- 1108 E 8th St
- 116 4th Ave
- 603 5th Ave
- 1031 Fir Ave
- 409 Maple Ave
- 211 Woodland Ave
- 319 6th Ave
- 120 Forrest Ave
- 419 Durland Ave
- 310 (and 814 w 4) 8th Ave
- 102 8th Ave Unit B
- 709 E Main St
- 11 Idaho Ave
- 15 Idaho Ave
- 15 & 15.5 Idaho Ave
- 15 & 15.5 Idaho Ave Unit 1 & 2
- 711 E Main St
- 19 Idaho Ave
- 12 Idaho Ave
- 16 Ohio Ave
- 16 Idaho Ave
- 613 E Main St
- 20 Idaho Ave
- 20 Ohio Ave
- 13 Washington Ave
- 601 E Main St
- 15 Washington Ave
- 619 E 4th St
- 613 E 4th St
- 17 Washington Ave
- 609 E 4th St
Your Personal Tour Guide
Ask me questions while you tour the home.