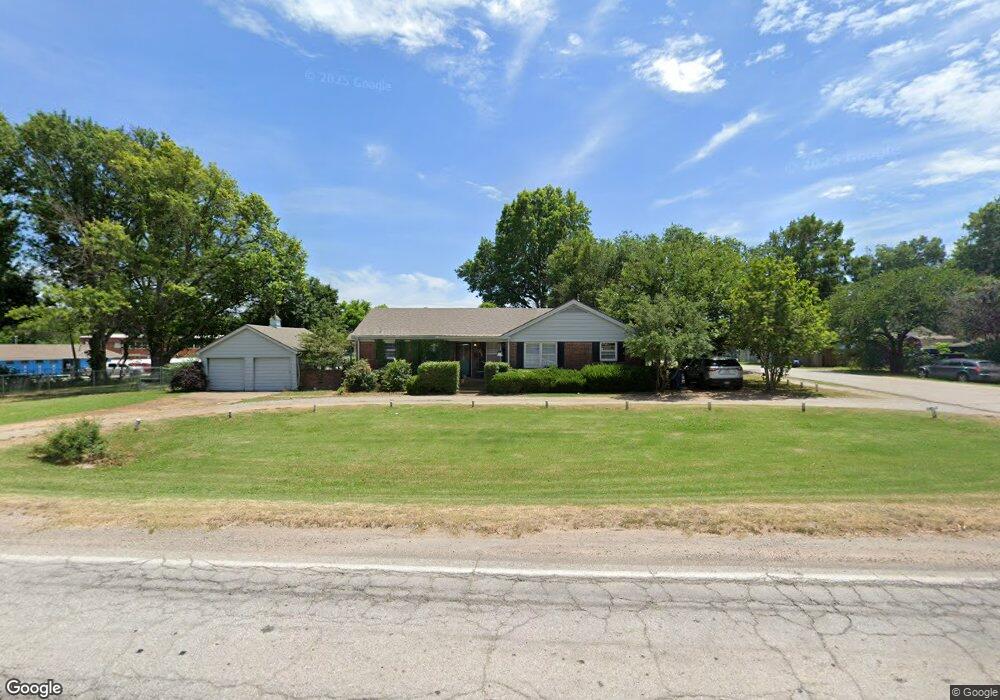
701 E Robert S Kerr Blvd Wynnewood, OK 73098
Estimated Value: $134,000 - $171,000
3
Beds
2
Baths
1,656
Sq Ft
$91/Sq Ft
Est. Value
About This Home
This home is located at 701 E Robert S Kerr Blvd, Wynnewood, OK 73098 and is currently estimated at $150,116, approximately $90 per square foot. 701 E Robert S Kerr Blvd is a home located in Garvin County with nearby schools including Central Elementary School, Wynnewood Middle School, and Wynnewood High School.
Ownership History
Date
Name
Owned For
Owner Type
Purchase Details
Closed on
Mar 24, 2025
Sold by
Baker Martha
Bought by
Harris Chris
Current Estimated Value
Purchase Details
Closed on
Aug 17, 2022
Sold by
Mary Coleman-Woolslayer Trust
Bought by
Baker Martins and Harris Christopher
Purchase Details
Closed on
Jan 27, 2021
Sold by
Coleman Woolslayer Mary and The Mary Coleman Woolslayer Tr
Bought by
Baker Martha S and The Martha S Baker Revocable T
Purchase Details
Closed on
Jul 1, 2010
Sold by
Coleman Woolslayer Mary
Bought by
Mary Coleman Woolslayer Trust
Purchase Details
Closed on
Aug 11, 2004
Sold by
Mclaughlin May Baker
Bought by
Woolslayer Mary Coleman
Purchase Details
Closed on
Aug 9, 2004
Sold by
Mclaughlin Walise Kathle
Bought by
Woolslayer Mary Coleman
Purchase Details
Closed on
Jun 10, 2004
Sold by
May Mary Kathleen
Bought by
Mclaughlin Walsie K
Create a Home Valuation Report for This Property
The Home Valuation Report is an in-depth analysis detailing your home's value as well as a comparison with similar homes in the area
Home Values in the Area
Average Home Value in this Area
Purchase History
| Date | Buyer | Sale Price | Title Company |
|---|---|---|---|
| Harris Chris | -- | None Listed On Document | |
| Baker Martins | -- | None Listed On Document | |
| Baker Martha S | $88,000 | None Available | |
| Mary Coleman Woolslayer Trust | -- | -- | |
| Woolslayer Mary Coleman | $32,000 | -- | |
| Woolslayer Mary Coleman | -- | -- | |
| Mclaughlin Walsie K | -- | -- |
Source: Public Records
Tax History Compared to Growth
Tax History
| Year | Tax Paid | Tax Assessment Tax Assessment Total Assessment is a certain percentage of the fair market value that is determined by local assessors to be the total taxable value of land and additions on the property. | Land | Improvement |
|---|---|---|---|---|
| 2024 | $526 | $7,231 | $496 | $6,735 |
| 2023 | $526 | $7,020 | $485 | $6,535 |
| 2022 | $566 | $6,473 | $400 | $6,073 |
| 2021 | $547 | $6,165 | $382 | $5,783 |
| 2020 | $539 | $6,064 | $559 | $5,505 |
| 2019 | $507 | $5,775 | $535 | $5,240 |
| 2018 | $471 | $5,501 | $535 | $4,966 |
| 2017 | $440 | $5,239 | $535 | $4,704 |
| 2016 | $416 | $4,989 | $535 | $4,454 |
| 2015 | $356 | $4,752 | $535 | $4,217 |
| 2014 | $357 | $4,752 | $535 | $4,217 |
Source: Public Records
Map
Nearby Homes
- 603 E Robert S Kerr Blvd
- 0 Oklahoma 29
- 605 E Jennings St
- 1006 E Chickasaw St
- 407 N Taylor Ave
- 406 S Gardner Ave
- 0 E Schmid St
- 200 E Juanita St
- 209 S East Ave
- 502 N Carr Ave
- 1400 E Schmid St
- 0 W Chickasaw St
- 1410 Prospect Dr
- 1002 N Carr Ave
- 506 Eastgate Ave
- 512 Eastgate Ave
- 605 W Robert S Kerr
- 24073 N County Road 3292
- 0002 Froman Rd
- 005 Scruggs
- 702 E Cherokee St
- 00000 Oklahoma 29
- 0000 Oklahoma 29
- 44260 Oklahoma 29
- 702 E Kerr Blvd
- 609 E Robert S Kerr Blvd
- 608 E Cherokee St
- 607 E Robert S Kerr Blvd
- 606 E Cherokee St
- 604 E Cherokee St
- 803 E Robert S Kerr Blvd
- 101 S Carr Ave
- 602 E Cherokee St
- 803 E Seminole St
- 601 E Cherokee St
- 805 E Kerr Blvd
- 704 E Seminole St
- 805 E Robert S Kerr Blvd
- 39957 E County Road 1634
- 39800 E County Road 1634