
Seller's Agent in 2026
Karen Huelsman
Irongate Inc.
(937) 478-3410
1 in this area
54 Total Sales
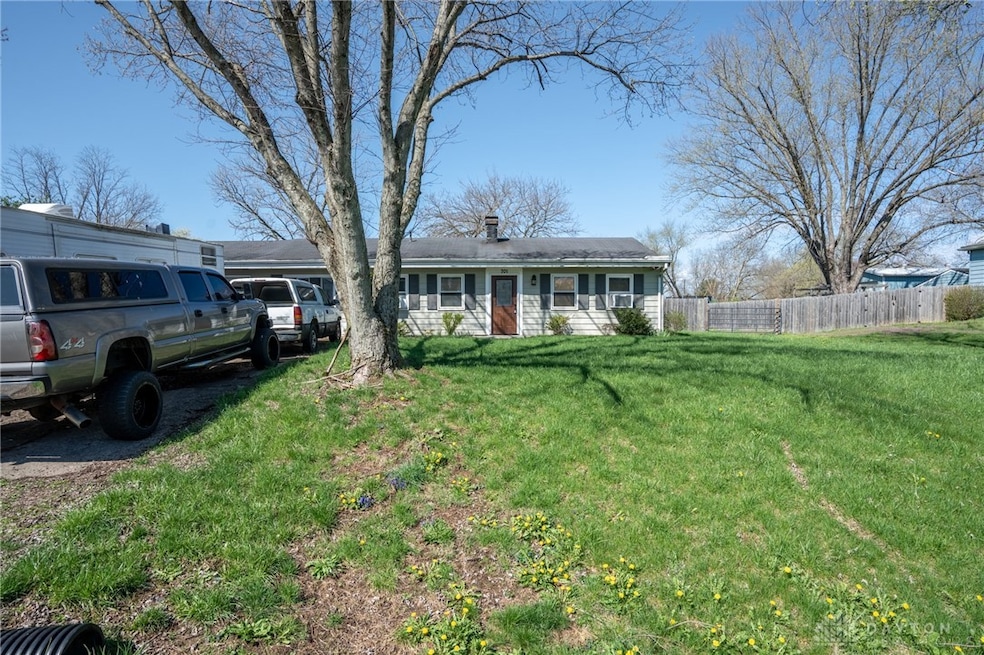
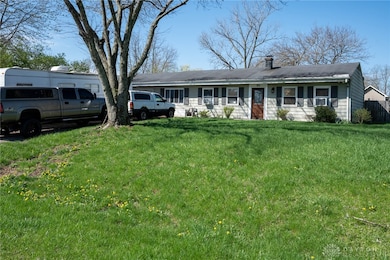
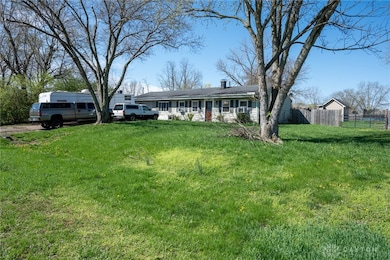
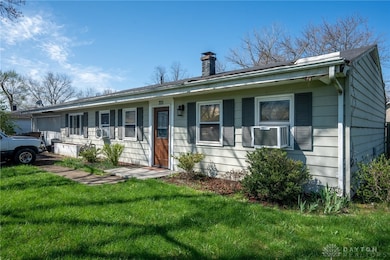
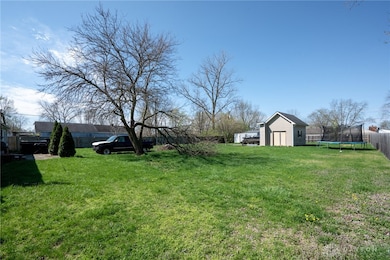
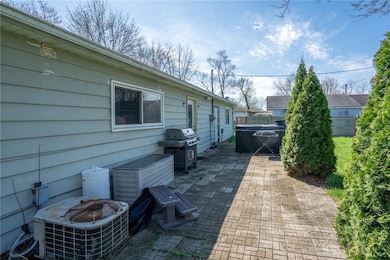
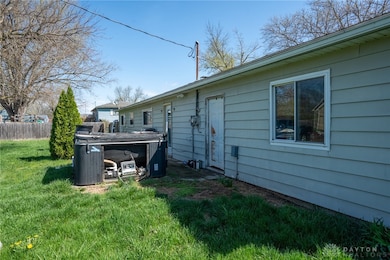
AUCTION! Property is NOT distressed or Bank-owned, it is being sold as part of an ESTATE Ranch home on large fenced lot, with many updates completed (homeowner was in construction; specializing in custom tile work). Oversized two car garage PLUS two OUTBUILDINGS, one is sturdy and may have been a shipping container. Bathroom, floors updated and carpet appears to be very recent. Whole house and termite inspections have been performed and available for your review. Property will sell above a Probate Court Approved minimum bid of ONLY $100,000.! 10% Buyer's Premium is in effect. AUCTION: TUESDAY DECEMBER 9, 2025 @ 4:30 pm in-person at the Property. Never been to Auction before? Contact listing Realtor/Auctioneer CAI with ALL your Auction questions! Buyer's Agents Welcomed and Encouraged! Great location, private neighborhood.
Last Agent to Sell the Property
Irongate Inc. Brokerage Phone: (937) 426-0800 License #2007000969 Listed on: 12/02/2025
| Date | Type | Sale Price | Title Company |
|---|---|---|---|
| Fiduciary Deed | $134,200 | None Listed On Document | |
| Quit Claim Deed | -- | -- | |
| Warranty Deed | $105,000 | Home Services Title | |
| Sheriffs Deed | $56,667 | -- | |
| Deed | -- | -- | |
| Deed | -- | -- |
| Date | Status | Loan Amount | Loan Type |
|---|---|---|---|
| Previous Owner | $103,098 | FHA |
| Date | Event | Price | List to Sale | Price per Sq Ft |
|---|---|---|---|---|
| 01/08/2026 01/08/26 | Sold | $134,200 | +34.2% | $112 / Sq Ft |
| 12/15/2025 12/15/25 | Pending | -- | -- | -- |
| 12/02/2025 12/02/25 | For Sale | $100,000 | -- | $84 / Sq Ft |
| Year | Tax Paid | Tax Assessment Tax Assessment Total Assessment is a certain percentage of the fair market value that is determined by local assessors to be the total taxable value of land and additions on the property. | Land | Improvement |
|---|---|---|---|---|
| 2025 | $2,142 | $53,920 | $17,500 | $36,420 |
| 2024 | $2,142 | $53,920 | $17,500 | $36,420 |
| 2023 | $1,882 | $41,737 | $11,812 | $29,925 |
| 2022 | $1,907 | $41,738 | $11,813 | $29,925 |
| 2021 | $1,699 | $41,738 | $11,813 | $29,925 |
| 2020 | $1,515 | $32,508 | $9,450 | $23,058 |
| 2019 | $1,567 | $33,138 | $9,450 | $23,688 |
| 2018 | $1,571 | $33,138 | $9,450 | $23,688 |
| 2017 | $1,420 | $27,696 | $8,008 | $19,688 |
| 2016 | $1,216 | $27,160 | $8,008 | $19,152 |
| 2015 | $1,219 | $27,160 | $8,008 | $19,152 |
| 2014 | $1,211 | $27,160 | $8,010 | $19,150 |
| 2013 | $1,207 | $35,620 | $10,500 | $25,120 |
Seller's Agent in 2026
Karen Huelsman
Irongate Inc.
(937) 478-3410
1 in this area
54 Total Sales
Buyer's Agent in 2026
Andrew Gaydosh
eXp Realty
(937) 305-9570
8 in this area
1,085 Total Sales
Source: Dayton REALTORS®
MLS Number: 948781
APN: 01-32-427-011
Disclaimer: Certain information contained herein is derived from information provided by parties other than Homes.com. All information provided is deemed reliable, but is not guaranteed to be accurate and should be independently verified.
![]() The information is being provided by Dayton Area Board of Realtors MLS. Information deemed reliable but not guaranteed. Information is provided for the consumer's personal, non-commercial use, and may not be used for any purpose other than the identification of potential properties for purchase. Copyright 2026 Dayton Area Board of Realtors MLS. All Rights Reserved.
The information is being provided by Dayton Area Board of Realtors MLS. Information deemed reliable but not guaranteed. Information is provided for the consumer's personal, non-commercial use, and may not be used for any purpose other than the identification of potential properties for purchase. Copyright 2026 Dayton Area Board of Realtors MLS. All Rights Reserved.
Ask me questions while you tour the home.