Estimated Value: $308,000 - $356,000
2
Beds
1
Bath
1,274
Sq Ft
$266/Sq Ft
Est. Value
About This Home
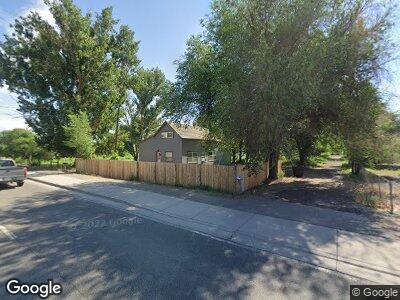
This home is located at 701 Highway 50, Delta, CO 81416 and is currently estimated at $339,135, approximately $266 per square foot. 701 Highway 50 is a home located in Delta County with nearby schools including Garnet Mesa Elementary School, Lincoln Elementary School, and Delta Middle School.
Ownership History
Date
Name
Owned For
Owner Type
Purchase Details
Closed on
Oct 29, 2021
Sold by
Whittington Toby
Bought by
Anaya Eleno and Mahan Ashley
Current Estimated Value
Home Financials for this Owner
Home Financials are based on the most recent Mortgage that was taken out on this home.
Original Mortgage
$272,727
Outstanding Balance
$255,088
Interest Rate
2.8%
Mortgage Type
New Conventional
Estimated Equity
$68,167
Purchase Details
Closed on
May 12, 2015
Sold by
Menzies Steven and Menzies Debra L
Bought by
Whittington Toby
Home Financials for this Owner
Home Financials are based on the most recent Mortgage that was taken out on this home.
Original Mortgage
$42,000
Interest Rate
6.25%
Mortgage Type
Seller Take Back
Purchase Details
Closed on
Apr 3, 2008
Sold by
Boyd Jerry D and Schroeder Ronald
Bought by
Menzies Steven and Menzies Debra L
Create a Home Valuation Report for This Property
The Home Valuation Report is an in-depth analysis detailing your home's value as well as a comparison with similar homes in the area
Home Values in the Area
Average Home Value in this Area
Purchase History
| Date | Buyer | Sale Price | Title Company |
|---|---|---|---|
| Anaya Eleno | $270,000 | Fidelity National Title | |
| Whittington Toby | $47,000 | Land Title Guarantee Company | |
| Menzies Steven | $106,000 | Security Title |
Source: Public Records
Mortgage History
| Date | Status | Borrower | Loan Amount |
|---|---|---|---|
| Open | Anaya Eleno | $272,727 | |
| Previous Owner | Whittington Toby | $65,000 | |
| Previous Owner | Whittington Toby | $60,000 | |
| Previous Owner | Whittington Toby | $42,000 |
Source: Public Records
Tax History Compared to Growth
Tax History
| Year | Tax Paid | Tax Assessment Tax Assessment Total Assessment is a certain percentage of the fair market value that is determined by local assessors to be the total taxable value of land and additions on the property. | Land | Improvement |
|---|---|---|---|---|
| 2023 | $1,129 | $17,055 | $3,802 | $13,253 |
| 2022 | $820 | $12,705 | $3,128 | $9,577 |
| 2021 | $320 | $5,050 | $3,218 | $1,832 |
| 2020 | $285 | $4,441 | $2,860 | $1,581 |
| 2019 | $282 | $4,441 | $2,860 | $1,581 |
| 2018 | $228 | $3,449 | $2,016 | $1,433 |
| 2017 | $221 | $3,449 | $2,016 | $1,433 |
| 2016 | $227 | $3,873 | $2,229 | $1,644 |
| 2014 | -- | $5,652 | $2,428 | $3,224 |
Source: Public Records
Map
Nearby Homes
- 1554 G96 Ln
- 676 Highway 50 Unit 2
- 167 Gunnison River Dr
- 1534 Highway 50
- 713 Crawford Ave
- 145 Meeker St
- 184 Garnet Ave
- 291 E 2nd St Unit D
- 207 Meeker St Unit A and B
- 120 Silver St
- 65 Circle Dr
- 249 Park St
- 221 Leon St
- 1618 H75 Rd
- 709 E 3rd St
- 640 E 3rd St
- 320 Grand Blvd
- 1520 Highway 92
- 188 Bert St
- 211 W 4th St