Estimated Value: $179,000 - $228,864
3
Beds
2
Baths
1,341
Sq Ft
$154/Sq Ft
Est. Value
About This Home
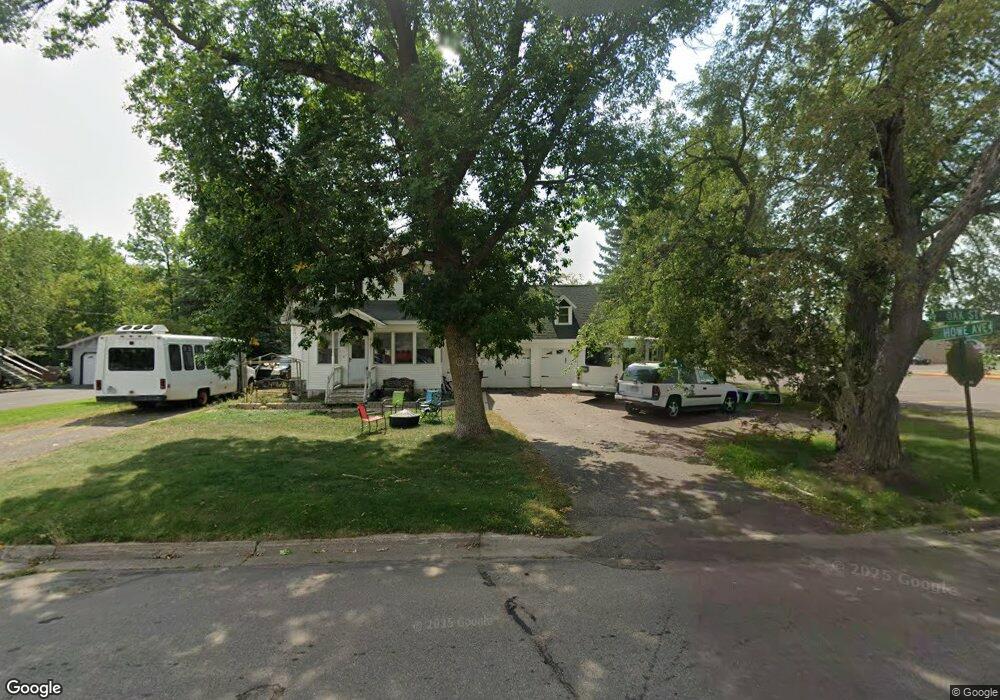
This home is located at 701 Howe Ave, Mora, MN 55051 and is currently estimated at $206,466, approximately $153 per square foot. 701 Howe Ave is a home located in Kanabec County with nearby schools including Fairview Elementary School, Mora Elementary School, and Mora Secondary School.
Ownership History
Date
Name
Owned For
Owner Type
Purchase Details
Closed on
May 24, 2012
Sold by
Bank Of America Na
Bought by
Harer Brynna
Current Estimated Value
Home Financials for this Owner
Home Financials are based on the most recent Mortgage that was taken out on this home.
Original Mortgage
$56,100
Interest Rate
3.65%
Mortgage Type
New Conventional
Purchase Details
Closed on
Jul 26, 2011
Sold by
Solberg Sheila and Solberg Lonnie
Bought by
Bac Home Loans Servicing Lp and Countrywide Home Loans Servicing Lp
Create a Home Valuation Report for This Property
The Home Valuation Report is an in-depth analysis detailing your home's value as well as a comparison with similar homes in the area
Home Values in the Area
Average Home Value in this Area
Purchase History
| Date | Buyer | Sale Price | Title Company |
|---|---|---|---|
| Harer Brynna | $55,000 | Title & Closing Inc | |
| Bac Home Loans Servicing Lp | $161,565 | None Available |
Source: Public Records
Mortgage History
| Date | Status | Borrower | Loan Amount |
|---|---|---|---|
| Previous Owner | Harer Brynna | $56,100 |
Source: Public Records
Tax History
| Year | Tax Paid | Tax Assessment Tax Assessment Total Assessment is a certain percentage of the fair market value that is determined by local assessors to be the total taxable value of land and additions on the property. | Land | Improvement |
|---|---|---|---|---|
| 2025 | $2,718 | $190,900 | $75,300 | $115,600 |
| 2024 | $2,708 | $185,400 | $75,300 | $110,100 |
| 2023 | $2,434 | $184,600 | $75,300 | $109,300 |
| 2022 | $3,092 | $159,500 | $73,300 | $86,200 |
| 2021 | $2,950 | $175,200 | $68,300 | $106,900 |
| 2020 | $1,894 | $168,000 | $68,300 | $99,700 |
| 2018 | $1,628 | $98,400 | $26,577 | $71,823 |
| 2017 | $1,558 | $85,500 | $21,869 | $63,631 |
| 2016 | $1,370 | $79,700 | $21,392 | $58,308 |
| 2015 | $1,236 | $68,700 | $16,963 | $51,737 |
| 2013 | $1,236 | $67,300 | $16,843 | $50,457 |
Source: Public Records
Map
Nearby Homes
- 330 Watkins St
- 22-08053-0 Minnesota 23
- 22-08054-0 Minnesota 23
- 22-08133-0 Minnesota 23
- 930 Highway 65 S
- 702 Sunset Ln
- 523 Vasa Way
- 519 Vasa Way
- 515 Vasa Way
- 509 Vasa Way
- 505 Vasa Way
- 524 Vasa Way
- 520 Vasa Way
- 510 Vasa Way
- 504 Vasa Way
- 500 Vasa Way
- 908 Eldris Way
- 914 Eldris Way
- 748 Highway 65 N
- 918 Eldris Way
Your Personal Tour Guide
Ask me questions while you tour the home.