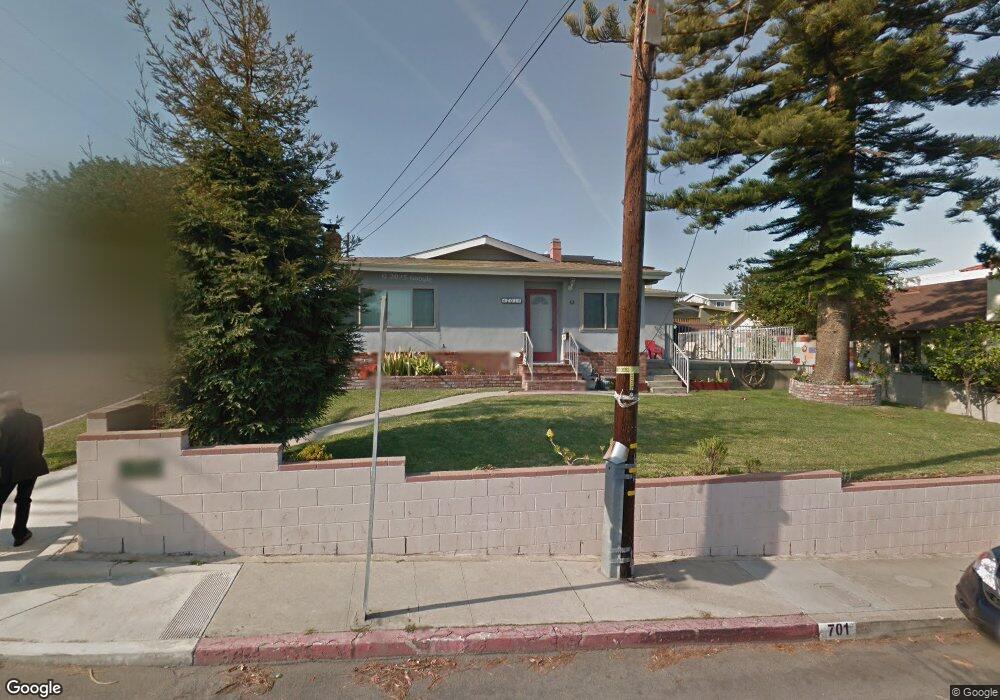
701 Loma Vista St El Segundo, CA 90245
Estimated Value: $1,571,000 - $1,692,000
3
Beds
2
Baths
1,320
Sq Ft
$1,233/Sq Ft
Est. Value
About This Home
This home is located at 701 Loma Vista St, El Segundo, CA 90245 and is currently estimated at $1,627,854, approximately $1,233 per square foot. 701 Loma Vista St is a home located in Los Angeles County with nearby schools including Richmond Street Elementary School, El Segundo Middle School, and El Segundo High School.
Ownership History
Date
Name
Owned For
Owner Type
Purchase Details
Closed on
Aug 23, 2016
Sold by
Stock Jay
Bought by
Stock Jay N and Stock Bridget T
Current Estimated Value
Purchase Details
Closed on
Aug 25, 2015
Sold by
Stock Jay
Bought by
Stock Jay and Stock Bridget
Purchase Details
Closed on
May 16, 2006
Sold by
Stocks Darlene L
Bought by
Stock Jay N and Ptak Bridget
Home Financials for this Owner
Home Financials are based on the most recent Mortgage that was taken out on this home.
Original Mortgage
$100,000
Outstanding Balance
$58,411
Interest Rate
6.55%
Mortgage Type
Fannie Mae Freddie Mac
Estimated Equity
$1,569,443
Purchase Details
Closed on
Feb 22, 2005
Sold by
Burnham Brian L
Bought by
Stocks Darlene L
Home Financials for this Owner
Home Financials are based on the most recent Mortgage that was taken out on this home.
Original Mortgage
$576,000
Interest Rate
1%
Mortgage Type
New Conventional
Purchase Details
Closed on
Sep 24, 2004
Sold by
Stocks Darlene L
Bought by
Stocks Darlene L
Home Financials for this Owner
Home Financials are based on the most recent Mortgage that was taken out on this home.
Original Mortgage
$62,000
Interest Rate
5.77%
Mortgage Type
Credit Line Revolving
Purchase Details
Closed on
Jun 22, 2004
Sold by
Stocks Darlene L
Bought by
Stocks Darlene L
Home Financials for this Owner
Home Financials are based on the most recent Mortgage that was taken out on this home.
Original Mortgage
$500,000
Interest Rate
6.27%
Mortgage Type
New Conventional
Purchase Details
Closed on
Mar 13, 2003
Sold by
Stocks Darlene L
Bought by
Stocks Darlene L
Home Financials for this Owner
Home Financials are based on the most recent Mortgage that was taken out on this home.
Original Mortgage
$59,000
Interest Rate
5.73%
Mortgage Type
Credit Line Revolving
Purchase Details
Closed on
Apr 24, 2000
Sold by
Stocks John A
Bought by
Stocks Darlene L
Home Financials for this Owner
Home Financials are based on the most recent Mortgage that was taken out on this home.
Original Mortgage
$280,000
Interest Rate
8.3%
Purchase Details
Closed on
Mar 31, 1997
Sold by
Ramey Ivar
Bought by
Stocks John A and Stocks Darlene L
Home Financials for this Owner
Home Financials are based on the most recent Mortgage that was taken out on this home.
Original Mortgage
$220,500
Interest Rate
7.87%
Create a Home Valuation Report for This Property
The Home Valuation Report is an in-depth analysis detailing your home's value as well as a comparison with similar homes in the area
Home Values in the Area
Average Home Value in this Area
Purchase History
| Date | Buyer | Sale Price | Title Company |
|---|---|---|---|
| Stock Jay N | -- | None Available | |
| Stock Jay | -- | None Available | |
| Stock Jay N | $906,000 | Stewart Title Of Ca Inc | |
| Stocks Darlene L | -- | Ticor Title Co Fullerton | |
| Stocks Darlene L | -- | Ticor Title Company Fullerto | |
| Burnham Brian L | -- | Ticor Title Company Fullerto | |
| Stocks Darlene L | -- | Gateway Title Company | |
| Stocks Darlene L | -- | Fidelity | |
| Stocks Darlene L | -- | California Counties Title Co | |
| Stocks John A | $245,000 | Fidelity National Title Ins |
Source: Public Records
Mortgage History
| Date | Status | Borrower | Loan Amount |
|---|---|---|---|
| Open | Stock Jay N | $100,000 | |
| Previous Owner | Stocks Darlene L | $576,000 | |
| Previous Owner | Burnham Brian L | $62,000 | |
| Previous Owner | Stocks Darlene L | $500,000 | |
| Previous Owner | Stocks Darlene L | $59,000 | |
| Previous Owner | Stocks Darlene L | $280,000 | |
| Previous Owner | Stocks John A | $220,500 |
Source: Public Records
Tax History Compared to Growth
Tax History
| Year | Tax Paid | Tax Assessment Tax Assessment Total Assessment is a certain percentage of the fair market value that is determined by local assessors to be the total taxable value of land and additions on the property. | Land | Improvement |
|---|---|---|---|---|
| 2025 | $6,037 | $540,782 | $292,847 | $247,935 |
| 2024 | $6,037 | $530,179 | $287,105 | $243,074 |
| 2023 | $5,882 | $519,784 | $281,476 | $238,308 |
| 2022 | $5,944 | $509,593 | $275,957 | $233,636 |
| 2021 | $5,860 | $499,602 | $270,547 | $229,055 |
| 2019 | $5,661 | $484,785 | $262,523 | $222,262 |
| 2018 | $5,254 | $475,280 | $257,376 | $217,904 |
| 2016 | $5,095 | $456,827 | $247,383 | $209,444 |
| 2015 | $5,031 | $449,966 | $243,668 | $206,298 |
| 2014 | $4,929 | $441,152 | $238,895 | $202,257 |
Source: Public Records
Map
Nearby Homes
- 724 Loma Vista St
- 505 W Maple Ave
- 804 Hillcrest St
- 627 W Pine Ave
- 931 Hillcrest St
- 940 Hillcrest St
- 955 Virginia St
- 219 W Acacia Ave
- 770 W Imperial Ave Unit 85
- 935 Main St Unit 303
- 924 Main St
- 329 E Maple Ave
- 212 E Imperial Ave Unit A
- 212 E Imperial Ave Unit E
- 426 E Imperial Ave
- 516 Penn St
- 574 E Imperial Ave
- 608 Lomita St
- 1112 E Imperial Ave
- 1116 E Imperial Ave
- 709 Loma Vista St
- 613 W Palm Ave
- 713 Loma Vista St
- 641 Loma Vista St
- 617 W Palm Ave
- 717 Loma Vista St
- 608 W Palm Ave
- 635 Loma Vista St
- 612 W Palm Ave
- 621 W Palm Ave
- 644 Loma Vista St
- 535 W Palm Ave
- 723 Loma Vista St
- 716 Loma Vista St
- 631 Loma Vista St
- 618 W Palm Ave
- 606 W Oak Ave
- 720 Loma Vista St
- 612 W Oak Ave
- 625 W Palm Ave