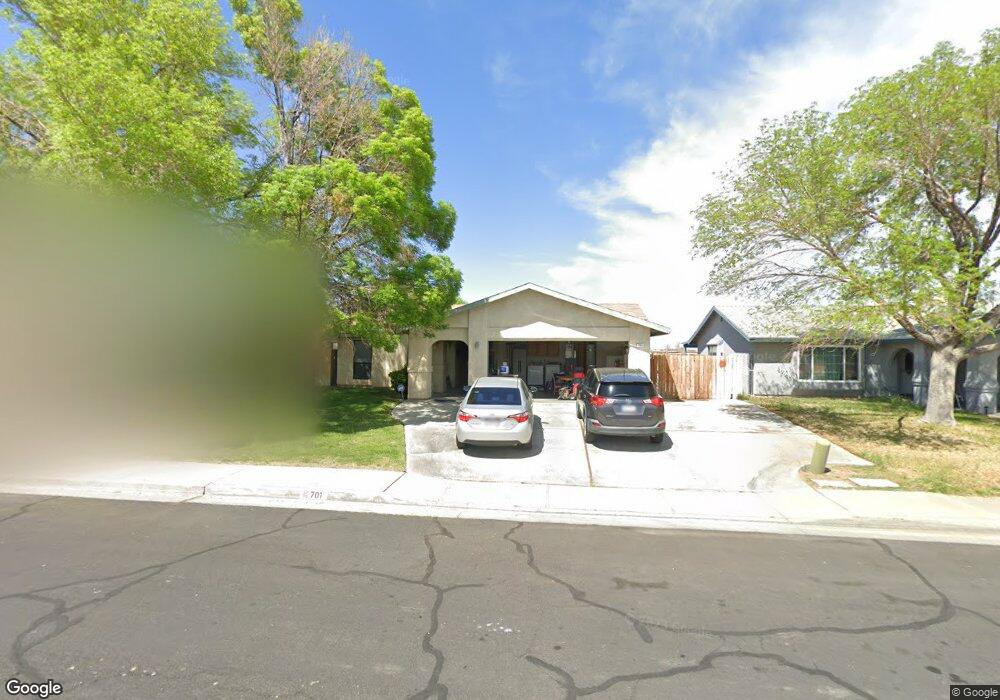
701 N Sunland Dr Unit F Ridgecrest, CA 93555
Estimated Value: $259,697 - $297,000
--
Bed
2
Baths
1,603
Sq Ft
$175/Sq Ft
Est. Value
About This Home
This home is located at 701 N Sunland Dr Unit F, Ridgecrest, CA 93555 and is currently estimated at $281,174, approximately $175 per square foot. 701 N Sunland Dr Unit F is a home located in Kern County with nearby schools including Pierce Elementary School, Murray Middle School, and Burroughs High School.
Ownership History
Date
Name
Owned For
Owner Type
Purchase Details
Closed on
Mar 15, 2024
Sold by
Huff James Michael and Shielda Jo
Bought by
Huff Family Trust and Huff
Current Estimated Value
Purchase Details
Closed on
Apr 15, 2009
Sold by
Owens Raymond D and Owens Jill D
Bought by
Huff James Michael and Huff Shielda Jo
Home Financials for this Owner
Home Financials are based on the most recent Mortgage that was taken out on this home.
Original Mortgage
$174,284
Interest Rate
4.8%
Mortgage Type
FHA
Purchase Details
Closed on
Jun 17, 1999
Sold by
Verna Brassfield Lester L and Verna L
Bought by
Owens Raymond D and Owens Jill D
Home Financials for this Owner
Home Financials are based on the most recent Mortgage that was taken out on this home.
Original Mortgage
$72,250
Interest Rate
7.24%
Create a Home Valuation Report for This Property
The Home Valuation Report is an in-depth analysis detailing your home's value as well as a comparison with similar homes in the area
Home Values in the Area
Average Home Value in this Area
Purchase History
| Date | Buyer | Sale Price | Title Company |
|---|---|---|---|
| Huff Family Trust | -- | None Listed On Document | |
| Huff James Michael | $177,500 | First American Title Company | |
| Owens Raymond D | $74,500 | First American Title Co |
Source: Public Records
Mortgage History
| Date | Status | Borrower | Loan Amount |
|---|---|---|---|
| Previous Owner | Huff James Michael | $174,284 | |
| Previous Owner | Owens Raymond D | $72,250 |
Source: Public Records
Tax History Compared to Growth
Tax History
| Year | Tax Paid | Tax Assessment Tax Assessment Total Assessment is a certain percentage of the fair market value that is determined by local assessors to be the total taxable value of land and additions on the property. | Land | Improvement |
|---|---|---|---|---|
| 2025 | $2,955 | $229,205 | $32,183 | $197,022 |
| 2024 | $2,866 | $224,711 | $31,552 | $193,159 |
| 2023 | $2,866 | $220,306 | $30,934 | $189,372 |
| 2022 | $2,808 | $215,987 | $30,328 | $185,659 |
| 2021 | $2,600 | $200,000 | $50,000 | $150,000 |
| 2020 | $2,486 | $193,000 | $48,000 | $145,000 |
| 2019 | $2,442 | $189,000 | $47,000 | $142,000 |
| 2018 | $2,415 | $187,000 | $47,000 | $140,000 |
| 2017 | $2,281 | $172,000 | $43,000 | $129,000 |
| 2016 | $2,002 | $151,000 | $38,000 | $113,000 |
| 2015 | $1,617 | $116,000 | $29,000 | $87,000 |
| 2014 | $1,774 | $141,000 | $35,000 | $106,000 |
Source: Public Records
Map
Nearby Homes
- 729 N Sunland Dr Unit H
- 142 Chambers St Unit K
- 134 N American St
- 124 Jacquelyn Ct
- 625 Cottonwood Dr
- 632-A Commercial
- 1 E Ridgecrest Blvd
- 317 N Gold Canyon St
- 525 E Ridgecrest Blvd Unit 11
- 0 S Gateway Blvd
- 504 Commercial Ave Unit A
- 2005 S American St
- 304 Palm Dr Unit G
- 217 S American St
- 205 Rancho St
- 112 Valley St
- 132 S Holly Canyon Dr
- 228 S Greenlawn St
- 206 S Holly Canyon Dr
- 0 E Ridgecrest Blvd
- 641 N Sunland Dr
- 705 N Sunland Dr
- 637 N Sunland Dr
- 709 N Sunland Dr
- 256 N Broadway St
- 249 Chambers St Unit H
- 633 N Sunland Dr
- 713 N Sunland Dr Unit H
- 252 N Broadway St
- 245 Chambers St Unit H
- 629 N Sunland Dr
- 717 N Sunland Dr
- 634 N Sunland Dr
- 244 Chambers St
- 248 N Broadway St
- 241 Chambers St
- 628 N Sunland Dr
- 625 N Sunland Dr
- 721 N Sunland Dr
- 240 Chambers St