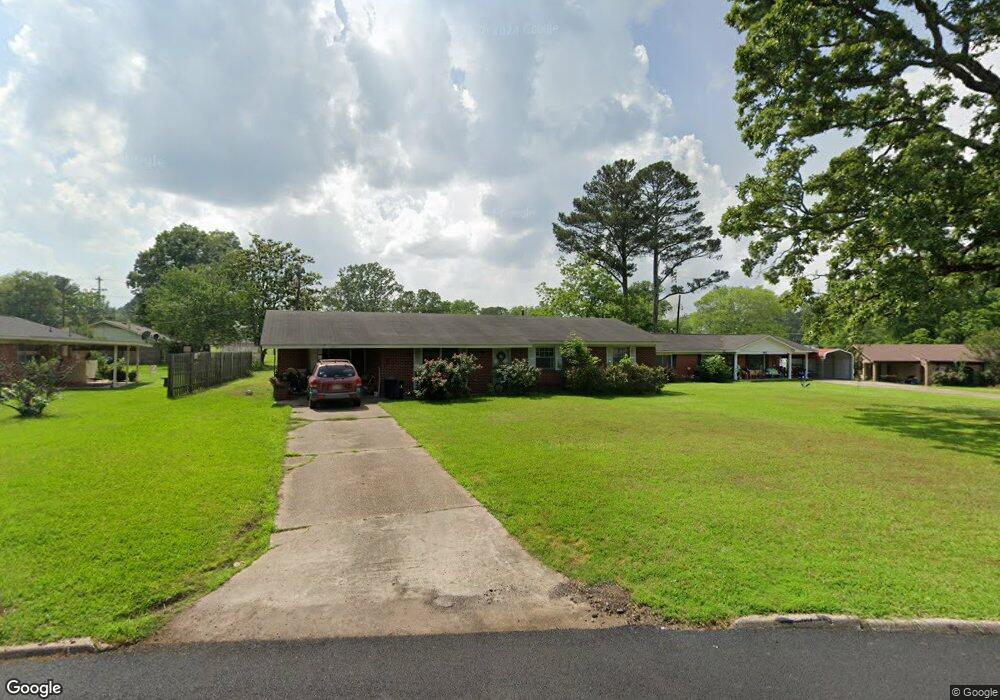
701 Park Cir West Point, MS 39773
Estimated Value: $137,000 - $187,000
3
Beds
--
Bath
1,558
Sq Ft
$104/Sq Ft
Est. Value
About This Home
This home is located at 701 Park Cir, West Point, MS 39773 and is currently estimated at $162,595, approximately $104 per square foot. 701 Park Cir is a home located in Clay County with nearby schools including East Side Elementary School, West Clay Elementary School, and Church Hill Elementary School.
Ownership History
Date
Name
Owned For
Owner Type
Purchase Details
Closed on
Jan 21, 2020
Sold by
Pendley Geonette H
Bought by
Hamblin Mary E and Hamblin Randy
Current Estimated Value
Home Financials for this Owner
Home Financials are based on the most recent Mortgage that was taken out on this home.
Original Mortgage
$71,225
Outstanding Balance
$62,413
Interest Rate
3.62%
Mortgage Type
FHA
Estimated Equity
$100,182
Purchase Details
Closed on
Feb 14, 2012
Sold by
Pendley Geonette H
Bought by
Riley Andy
Create a Home Valuation Report for This Property
The Home Valuation Report is an in-depth analysis detailing your home's value as well as a comparison with similar homes in the area
Purchase History
| Date | Buyer | Sale Price | Title Company |
|---|---|---|---|
| Hamblin Mary E | -- | -- | |
| Riley Andy | -- | -- |
Source: Public Records
Mortgage History
| Date | Status | Borrower | Loan Amount |
|---|---|---|---|
| Open | Hamblin Mary E | $71,225 |
Source: Public Records
Tax History
| Year | Tax Paid | Tax Assessment Tax Assessment Total Assessment is a certain percentage of the fair market value that is determined by local assessors to be the total taxable value of land and additions on the property. | Land | Improvement |
|---|---|---|---|---|
| 2025 | $710 | $13,090 | $1,800 | $11,290 |
| 2024 | $710 | $13,090 | $1,800 | $11,290 |
| 2023 | $1,645 | $10,988 | $1,800 | $9,188 |
| 2022 | $605 | $10,988 | $1,800 | $9,188 |
| 2021 | $600 | $10,988 | $1,800 | $9,188 |
| 2020 | $0 | $7,269 | $1,200 | $6,069 |
| 2019 | $0 | $7,269 | $1,200 | $6,069 |
| 2018 | $0 | $7,269 | $1,200 | $6,069 |
| 2017 | $0 | $7,269 | $1,200 | $6,069 |
| 2016 | -- | $7,269 | $1,200 | $6,069 |
| 2015 | -- | $6,653 | $1,200 | $5,453 |
| 2014 | -- | $6,653 | $1,200 | $5,453 |
| 2013 | -- | $6,653 | $1,200 | $5,453 |
Source: Public Records
Map
Nearby Homes
- 761 E Morrow St
- 530 E Morrow St
- 27045 E Main St
- 26596 E Main St
- 913 E Westbrook St
- 26852 E Main St
- 341 Mccord St
- 26788 E Main St
- 551 E Westbrook St
- 105 Converse Dr
- 237 Guyton Cir
- 218 Lewellen St
- 228 Mccord St
- 123 Cottrell St
- 278 Converse Dr
- 507 S Eshman Ave
- 472 S Eshman Ave
- 44 Torbert Dr
- 238 Calhoun St
- 405 S Eshman Ave
Your Personal Tour Guide
Ask me questions while you tour the home.