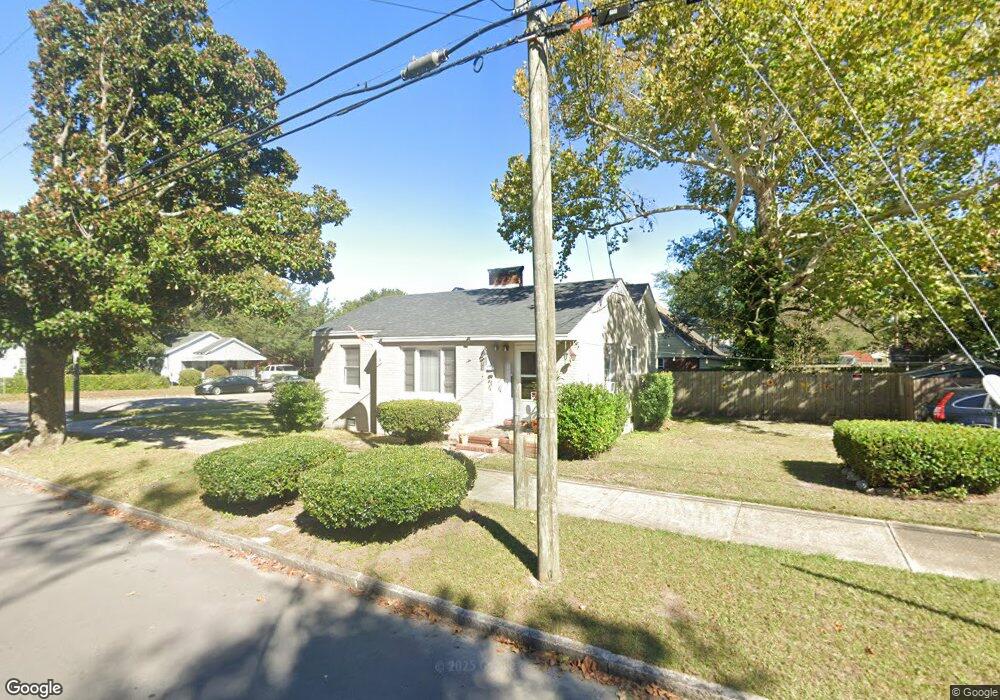
701 S 13th St Wilmington, NC 28401
Dry Pond-South Side NeighborhoodEstimated Value: $209,000 - $236,000
2
Beds
1
Bath
794
Sq Ft
$280/Sq Ft
Est. Value
About This Home
This home is located at 701 S 13th St, Wilmington, NC 28401 and is currently estimated at $222,138, approximately $279 per square foot. 701 S 13th St is a home located in New Hanover County with nearby schools including Forest Hills Global Elementary School, Williston Middle School, and John T. Hoggard High School.
Ownership History
Date
Name
Owned For
Owner Type
Purchase Details
Closed on
Oct 7, 2005
Sold by
Thompson Paul L and Thompson Susan B
Bought by
Paul Thompson House Rentals Llc
Current Estimated Value
Purchase Details
Closed on
Aug 19, 2002
Sold by
Stokes Charles W Iii Madeline
Bought by
Thompson Paul Susan B
Purchase Details
Closed on
Apr 14, 1993
Sold by
Stokes Margaret
Bought by
Stokes Charles W
Purchase Details
Closed on
Apr 9, 1970
Sold by
Nash Hattie
Bought by
Stokes Margaret Nash
Purchase Details
Closed on
Jun 26, 1968
Sold by
Nash Leroy
Bought by
Nash Hattie
Purchase Details
Closed on
Oct 6, 1947
Sold by
Hinson M T Helen T
Bought by
Nash Leroy Hattie
Create a Home Valuation Report for This Property
The Home Valuation Report is an in-depth analysis detailing your home's value as well as a comparison with similar homes in the area
Home Values in the Area
Average Home Value in this Area
Purchase History
| Date | Buyer | Sale Price | Title Company |
|---|---|---|---|
| Paul Thompson House Rentals Llc | -- | None Available | |
| Thompson Paul Susan B | $40,000 | -- | |
| Stokes Charles W | -- | -- | |
| Stokes Margaret Nash | -- | -- | |
| Nash Hattie | -- | -- | |
| Nash Leroy Hattie | -- | -- |
Source: Public Records
Tax History Compared to Growth
Tax History
| Year | Tax Paid | Tax Assessment Tax Assessment Total Assessment is a certain percentage of the fair market value that is determined by local assessors to be the total taxable value of land and additions on the property. | Land | Improvement |
|---|---|---|---|---|
| 2025 | $1,323 | $224,800 | $69,300 | $155,500 |
| 2023 | $980 | $112,700 | $48,600 | $64,100 |
| 2022 | $958 | $112,700 | $48,600 | $64,100 |
| 2021 | $964 | $112,700 | $48,600 | $64,100 |
| 2020 | $553 | $52,500 | $10,600 | $41,900 |
| 2019 | $553 | $52,500 | $10,600 | $41,900 |
| 2018 | $553 | $52,500 | $10,600 | $41,900 |
| 2017 | $553 | $52,500 | $10,600 | $41,900 |
| 2016 | $547 | $49,400 | $19,100 | $30,300 |
| 2015 | $523 | $49,400 | $19,100 | $30,300 |
| 2014 | $501 | $49,400 | $19,100 | $30,300 |
Source: Public Records
Map
Nearby Homes