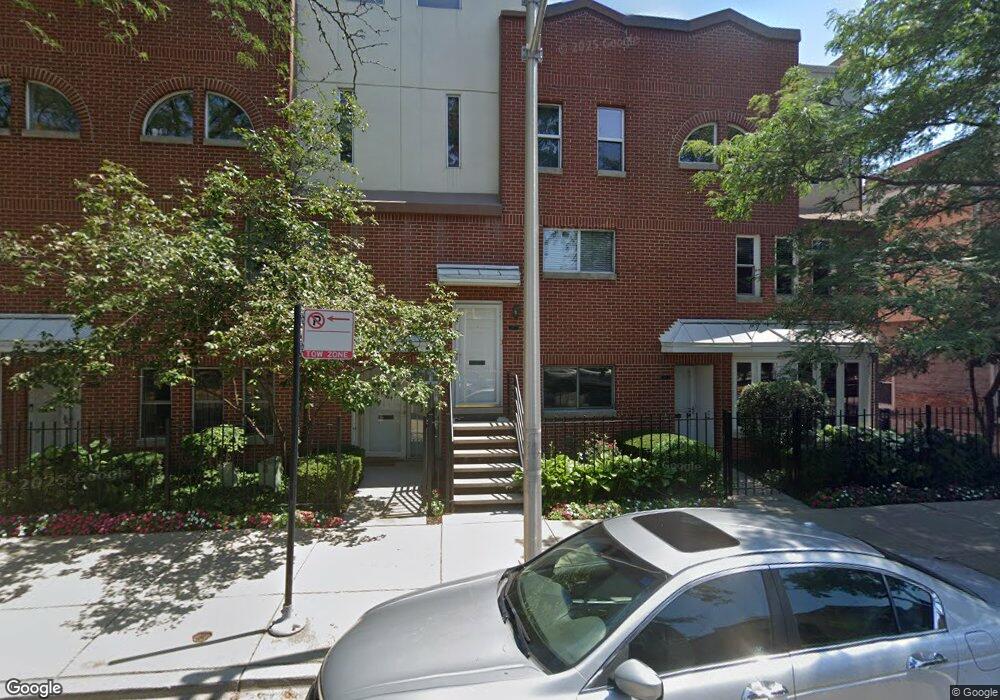
701 S Carpenter St Unit 701I Chicago, IL 60607
Little Italy NeighborhoodEstimated Value: $404,245 - $434,000
2
Beds
1
Bath
1,300
Sq Ft
$319/Sq Ft
Est. Value
About This Home
This home is located at 701 S Carpenter St Unit 701I, Chicago, IL 60607 and is currently estimated at $414,561, approximately $318 per square foot. 701 S Carpenter St Unit 701I is a home located in Cook County with nearby schools including John M. Smyth Elementary I.B. World School and Wells Community Academy High School.
Ownership History
Date
Name
Owned For
Owner Type
Purchase Details
Closed on
May 25, 2016
Sold by
Sheldon William Trevor
Bought by
Runnels Jamie E
Current Estimated Value
Home Financials for this Owner
Home Financials are based on the most recent Mortgage that was taken out on this home.
Original Mortgage
$256,500
Outstanding Balance
$208,548
Interest Rate
4.25%
Mortgage Type
New Conventional
Estimated Equity
$206,013
Purchase Details
Closed on
Jun 15, 1999
Sold by
Soble Michael B and Soble Susan
Bought by
Sheldon William Trevor
Home Financials for this Owner
Home Financials are based on the most recent Mortgage that was taken out on this home.
Original Mortgage
$188,750
Interest Rate
7.06%
Mortgage Type
Balloon
Create a Home Valuation Report for This Property
The Home Valuation Report is an in-depth analysis detailing your home's value as well as a comparison with similar homes in the area
Home Values in the Area
Average Home Value in this Area
Purchase History
| Date | Buyer | Sale Price | Title Company |
|---|---|---|---|
| Runnels Jamie E | $270,000 | Greater Metropolitan Title L | |
| Sheldon William Trevor | $207,500 | -- |
Source: Public Records
Mortgage History
| Date | Status | Borrower | Loan Amount |
|---|---|---|---|
| Open | Runnels Jamie E | $256,500 | |
| Previous Owner | Sheldon William Trevor | $188,750 |
Source: Public Records
Tax History Compared to Growth
Tax History
| Year | Tax Paid | Tax Assessment Tax Assessment Total Assessment is a certain percentage of the fair market value that is determined by local assessors to be the total taxable value of land and additions on the property. | Land | Improvement |
|---|---|---|---|---|
| 2024 | $6,532 | $38,421 | $9,377 | $29,044 |
| 2023 | $6,345 | $34,166 | $5,693 | $28,473 |
| 2022 | $6,345 | $34,166 | $5,693 | $28,473 |
| 2021 | $6,221 | $34,166 | $5,693 | $28,473 |
| 2020 | $6,095 | $30,371 | $5,693 | $24,678 |
| 2019 | $6,018 | $33,281 | $5,693 | $27,588 |
| 2018 | $6,595 | $33,281 | $5,693 | $27,588 |
| 2017 | $6,160 | $28,516 | $5,023 | $23,493 |
| 2016 | $5,211 | $28,516 | $5,023 | $23,493 |
| 2015 | $4,745 | $28,516 | $5,023 | $23,493 |
| 2014 | $4,268 | $25,574 | $4,269 | $21,305 |
| 2013 | $4,173 | $25,574 | $4,269 | $21,305 |
Source: Public Records
Map
Nearby Homes
- 847 S Miller St
- 902 S Morgan St
- 1155 W Vernon Park Place Unit 21
- 6 N Carpenter St Unit 5B
- 811 S Lytle St Unit 514
- 811 S Lytle St Unit 207
- 811 S Lytle St Unit 612
- 411 S Sangamon St Unit 8BC
- 411 S Sangamon St Unit 7C
- 913 W Van Buren St Unit 4C
- 933 W Van Buren St Unit 326
- 933 W Van Buren St Unit 516
- 321 S Sangamon St Unit 908
- 321 S Sangamon St Unit 605
- 400 S Green St Unit 406
- 400 S Green St Unit 305
- 400 S Green St Unit 508
- 1016 S Racine Ave Unit 201
- 331 S Peoria St Unit 206
- 323 S Racine Ave Unit 5A
- 701 S Carpenter St Unit D
- 701 S Carpenter St Unit C
- 701 S Carpenter St Unit 701E
- 701 S Carpenter St Unit 701C
- 701 S Carpenter St Unit 701A
- 701 S Carpenter St Unit 701G
- 701 S Carpenter St Unit 701J
- 701 S Carpenter St Unit 701B
- 701 S Carpenter St Unit 701H
- 701 S Carpenter St Unit G
- 701 S Carpenter St Unit I
- 701 S Carpenter St Unit J
- 701 S Carpenter St Unit B
- 701 S Carpenter St
- 1033 W Vernon Park Place Unit 1033
- 1033 W Vernon Park Place Unit 1033
- 1033 W Vernon Park Place Unit 1033
- 1033 W Vernon Park Place Unit 1033
- 1033 W Vernon Park Place Unit 1033
- 1033 W Vernon Park Place Unit 1033