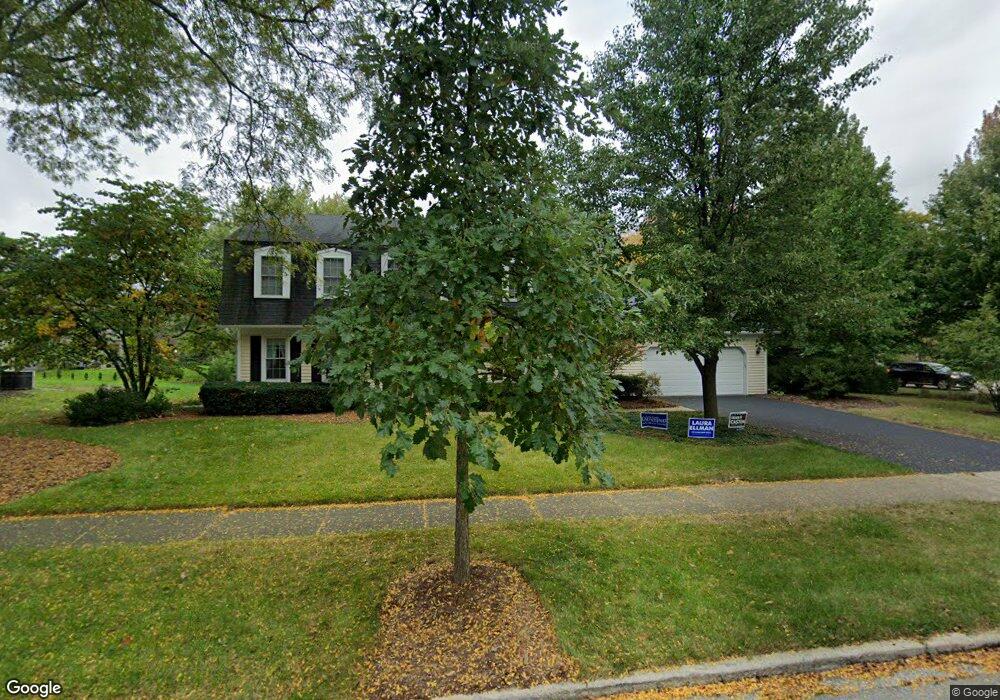
701 S Charles Ave Unit 3 Naperville, IL 60540
Hobson Village NeighborhoodEstimated Value: $588,679 - $723,000
--
Bed
1
Bath
2,230
Sq Ft
$292/Sq Ft
Est. Value
About This Home
This home is located at 701 S Charles Ave Unit 3, Naperville, IL 60540 and is currently estimated at $650,670, approximately $291 per square foot. 701 S Charles Ave Unit 3 is a home located in DuPage County with nearby schools including Prairie Elementary School, Washington Jr High School, and Naperville North High School.
Ownership History
Date
Name
Owned For
Owner Type
Purchase Details
Closed on
Aug 15, 2001
Sold by
Wallace Patrick J and Wallace Amy G
Bought by
Sellnow Paul and Sellnow Sabena B
Current Estimated Value
Home Financials for this Owner
Home Financials are based on the most recent Mortgage that was taken out on this home.
Original Mortgage
$222,000
Outstanding Balance
$87,412
Interest Rate
7.28%
Estimated Equity
$563,258
Purchase Details
Closed on
Mar 21, 1997
Sold by
Schwarz Daniel T and Schwarz Connie S
Bought by
Wallace Patrick J and Wallace Amy G
Home Financials for this Owner
Home Financials are based on the most recent Mortgage that was taken out on this home.
Original Mortgage
$183,600
Interest Rate
7.73%
Create a Home Valuation Report for This Property
The Home Valuation Report is an in-depth analysis detailing your home's value as well as a comparison with similar homes in the area
Home Values in the Area
Average Home Value in this Area
Purchase History
| Date | Buyer | Sale Price | Title Company |
|---|---|---|---|
| Sellnow Paul | $277,500 | First American Title Ins | |
| Wallace Patrick J | $204,000 | First American Title |
Source: Public Records
Mortgage History
| Date | Status | Borrower | Loan Amount |
|---|---|---|---|
| Open | Sellnow Paul | $222,000 | |
| Previous Owner | Wallace Patrick J | $183,600 | |
| Closed | Sellnow Paul | $27,750 |
Source: Public Records
Tax History Compared to Growth
Tax History
| Year | Tax Paid | Tax Assessment Tax Assessment Total Assessment is a certain percentage of the fair market value that is determined by local assessors to be the total taxable value of land and additions on the property. | Land | Improvement |
|---|---|---|---|---|
| 2024 | $8,894 | $161,177 | $72,765 | $88,412 |
| 2023 | $8,519 | $147,100 | $66,410 | $80,690 |
| 2022 | $8,679 | $140,100 | $63,250 | $76,850 |
| 2021 | $8,360 | $134,800 | $60,860 | $73,940 |
| 2020 | $8,182 | $132,380 | $59,770 | $72,610 |
| 2019 | $7,941 | $126,650 | $57,180 | $69,470 |
| 2018 | $7,867 | $125,490 | $57,180 | $68,310 |
| 2017 | $7,708 | $121,260 | $55,250 | $66,010 |
| 2016 | $7,552 | $116,870 | $53,250 | $63,620 |
| 2015 | $7,501 | $110,060 | $50,150 | $59,910 |
| 2014 | $7,210 | $102,860 | $46,870 | $55,990 |
| 2013 | $7,101 | $103,100 | $46,980 | $56,120 |
Source: Public Records
Map
Nearby Homes
- 907 Secretariat Dr
- 625 Edward Rd
- 616 Driftwood Ct
- 820 Prairie Ave
- 1000 E Porter Ave
- 488 S Columbia St
- 456 S Julian St
- 603 Driftwood Ct
- 959 Watercress Dr
- 440 S Columbia St
- 438 S Wright St
- 465 E Hillside Rd
- 706 S Loomis St Unit D
- 444 S Sleight St
- 212 Richard Rd
- 1133 Catherine Ave
- 912 E Chicago Ave
- 1125 Huntleigh Dr
- 1386 Old Dominion Ct
- 915 E Chicago Ave
- 1086 E Gartner Rd
- 707 S Charles Ave Unit 3
- 710 S Charles Ave
- 1080 E Gartner Rd
- 1081 Challdon Ct
- 713 S Charles Ave
- 1089 E Gartner Rd
- 714 S Charles Ave
- 1077 Challdon Ct
- 1085 E Gartner Rd Unit 3
- 1106 E Gartner Rd
- 618 S Charles Ave
- 719 S Charles Ave
- 719 S Charles Ave
- 1072 E Gartner Rd
- 1081 E Gartner Rd
- 718 S Charles Ave
- 1077 E Gartner Rd
- 1066 E Gartner Rd
- 1110 E Gartner Rd