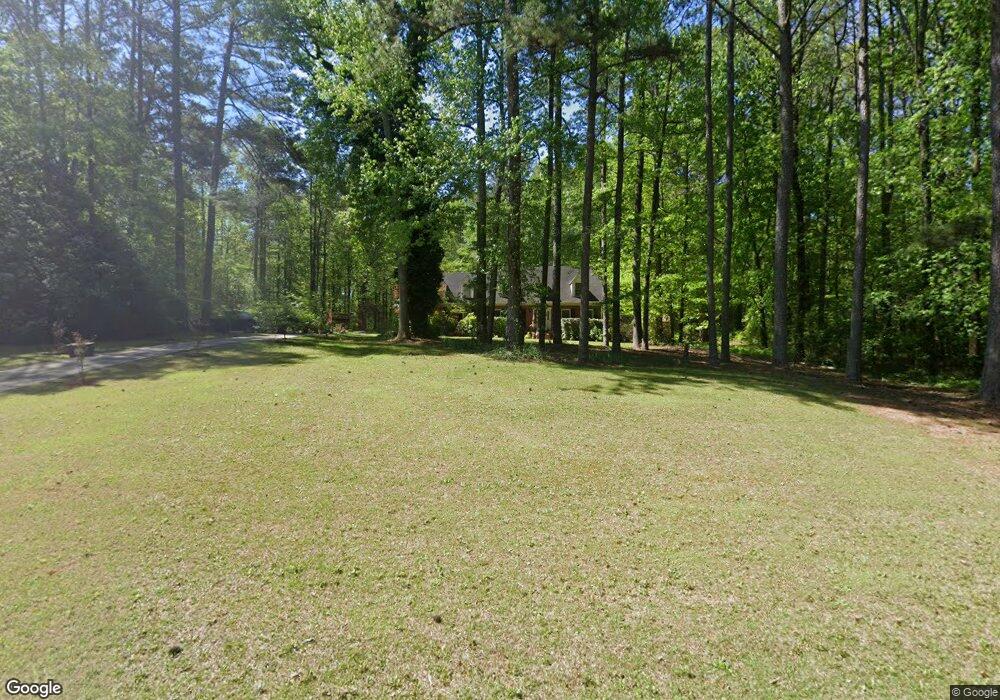
701 School Rd Hampton, GA 30228
Spalding County NeighborhoodEstimated Value: $212,000 - $303,000
3
Beds
4
Baths
1,776
Sq Ft
$147/Sq Ft
Est. Value
About This Home
This home is located at 701 School Rd, Hampton, GA 30228 and is currently estimated at $260,301, approximately $146 per square foot. 701 School Rd is a home located in Spalding County with nearby schools including Beaverbrook Elementary School, Cowan Road Middle School, and Griffin High School.
Ownership History
Date
Name
Owned For
Owner Type
Purchase Details
Closed on
May 21, 2004
Sold by
Burleson Russell W and Burleson Samantha B
Bought by
Elliott Richard D and Elliott Kimberly
Current Estimated Value
Home Financials for this Owner
Home Financials are based on the most recent Mortgage that was taken out on this home.
Original Mortgage
$163,417
Outstanding Balance
$76,908
Interest Rate
5.88%
Mortgage Type
VA
Estimated Equity
$183,393
Purchase Details
Closed on
Jun 5, 1991
Sold by
Mcleroy Johnny
Bought by
Burleson Russell W and Burleson Samantha B
Purchase Details
Closed on
Feb 1, 1991
Sold by
Johnson Gloria K
Bought by
Mcleroy Johnny
Purchase Details
Closed on
Jul 25, 1978
Sold by
Johnson Edward and Johnson Gloria K
Bought by
Johnson Gloria K
Purchase Details
Closed on
Jul 7, 1976
Sold by
Elder William H
Bought by
Johnson Edward and Johnson Gloria K
Purchase Details
Closed on
Oct 11, 1969
Bought by
Elder William H
Create a Home Valuation Report for This Property
The Home Valuation Report is an in-depth analysis detailing your home's value as well as a comparison with similar homes in the area
Home Values in the Area
Average Home Value in this Area
Purchase History
| Date | Buyer | Sale Price | Title Company |
|---|---|---|---|
| Elliott Richard D | $159,900 | -- | |
| Burleson Russell W | $90,000 | -- | |
| Mcleroy Johnny | $90,000 | -- | |
| Johnson Gloria K | -- | -- | |
| Johnson Edward | -- | -- | |
| Elder William H | -- | -- |
Source: Public Records
Mortgage History
| Date | Status | Borrower | Loan Amount |
|---|---|---|---|
| Open | Elliott Richard D | $163,417 |
Source: Public Records
Tax History
| Year | Tax Paid | Tax Assessment Tax Assessment Total Assessment is a certain percentage of the fair market value that is determined by local assessors to be the total taxable value of land and additions on the property. | Land | Improvement |
|---|---|---|---|---|
| 2025 | $2,666 | $76,316 | $11,160 | $65,156 |
| 2024 | $2,637 | $76,316 | $11,160 | $65,156 |
| 2023 | $2,666 | $71,717 | $11,160 | $60,557 |
| 2022 | $2,244 | $63,534 | $8,928 | $54,606 |
| 2021 | $2,005 | $56,951 | $8,928 | $48,023 |
| 2020 | $1,919 | $54,403 | $8,928 | $45,475 |
| 2019 | $1,958 | $54,403 | $8,928 | $45,475 |
| 2018 | $1,887 | $51,188 | $8,928 | $42,260 |
| 2017 | $1,836 | $51,188 | $8,928 | $42,260 |
| 2016 | $1,869 | $51,188 | $8,928 | $42,260 |
| 2015 | $1,925 | $51,188 | $8,928 | $42,260 |
| 2014 | $1,964 | $51,188 | $8,928 | $42,260 |
Source: Public Records
Map
Nearby Homes
- 1690 Patterson Rd
- 348 School Rd
- 2987 Steele Rd
- 1100 Patterson Rd
- 1060 Patterson Rd
- 166 Evans Rd
- 0 Elder Rd Unit 25075151
- 0 Elder Rd Unit 10619475
- 11899 Conrad Cir
- 466 & 472 Minter Dr
- 175 Mobley Rd
- 215 Mobley Rd
- 3330 Highway 3 N
- 4454 Georgia Highway 3
- 110 Fannin Rd
- 1980 Kilgore Rd
- 295 Hillview Rd
- 114 Woodcrest Dr
- 1558 Kilgore Rd
- 103 Hammond Rd
Your Personal Tour Guide
Ask me questions while you tour the home.