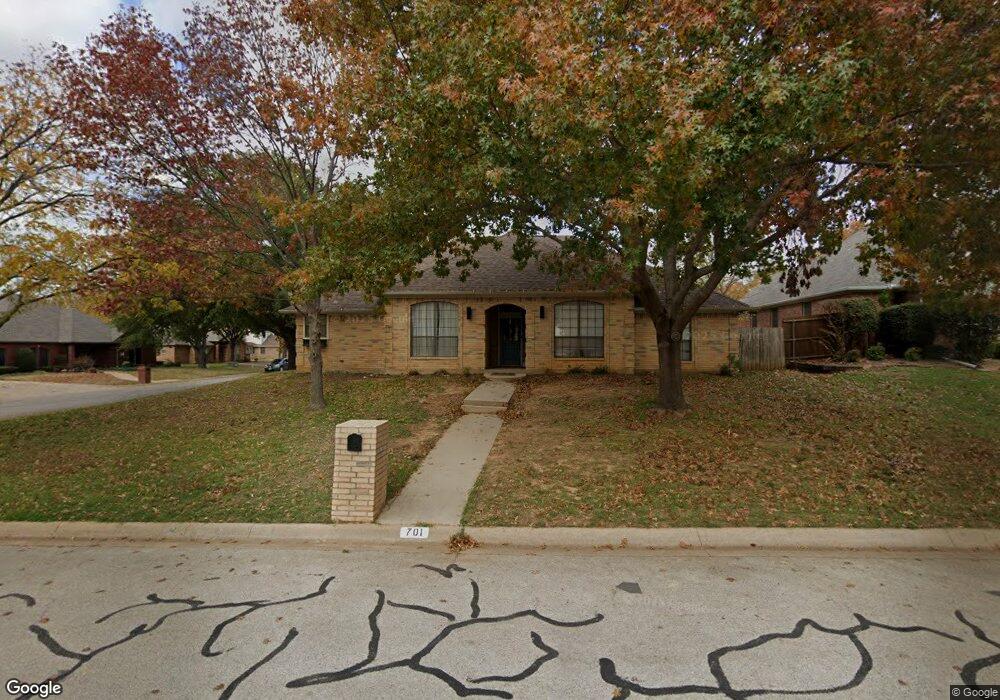
701 Smokerise Cir Denton, TX 76205
South Denton NeighborhoodEstimated Value: $464,000 - $501,000
4
Beds
3
Baths
2,452
Sq Ft
$196/Sq Ft
Est. Value
About This Home
This home is located at 701 Smokerise Cir, Denton, TX 76205 and is currently estimated at $480,152, approximately $195 per square foot. 701 Smokerise Cir is a home located in Denton County with nearby schools including Houston Elementary School, McMath Middle School, and Denton High School.
Ownership History
Date
Name
Owned For
Owner Type
Purchase Details
Closed on
Sep 7, 2018
Sold by
Cogan Cathy Anne
Bought by
Ogden Daniel W and Ogden Casandra D
Current Estimated Value
Home Financials for this Owner
Home Financials are based on the most recent Mortgage that was taken out on this home.
Original Mortgage
$270,750
Outstanding Balance
$235,624
Interest Rate
4.5%
Mortgage Type
New Conventional
Estimated Equity
$244,528
Purchase Details
Closed on
Dec 28, 2004
Sold by
Cantrell David G and Cantrell Brenda F
Bought by
Cogan Cathy Anne
Purchase Details
Closed on
May 23, 2000
Sold by
Harrison Phillip L and Harrison Mitzi
Bought by
Cantrel David G
Home Financials for this Owner
Home Financials are based on the most recent Mortgage that was taken out on this home.
Original Mortgage
$126,700
Interest Rate
8.17%
Create a Home Valuation Report for This Property
The Home Valuation Report is an in-depth analysis detailing your home's value as well as a comparison with similar homes in the area
Home Values in the Area
Average Home Value in this Area
Purchase History
| Date | Buyer | Sale Price | Title Company |
|---|---|---|---|
| Ogden Daniel W | -- | Alamo Title Flower Mound | |
| Cogan Cathy Anne | -- | Reunion Title | |
| Cantrel David G | -- | Fidelity National Title |
Source: Public Records
Mortgage History
| Date | Status | Borrower | Loan Amount |
|---|---|---|---|
| Open | Ogden Daniel W | $270,750 | |
| Previous Owner | Cantrel David G | $126,700 | |
| Closed | Cantrel David G | $23,750 |
Source: Public Records
Tax History Compared to Growth
Tax History
| Year | Tax Paid | Tax Assessment Tax Assessment Total Assessment is a certain percentage of the fair market value that is determined by local assessors to be the total taxable value of land and additions on the property. | Land | Improvement |
|---|---|---|---|---|
| 2025 | $7,201 | $394,000 | $108,694 | $285,306 |
| 2024 | $8,396 | $435,000 | $108,694 | $326,306 |
| 2023 | $6,550 | $405,713 | $108,694 | $320,636 |
| 2022 | $7,253 | $368,830 | $95,906 | $314,136 |
| 2021 | $7,454 | $335,300 | $63,938 | $271,362 |
| 2020 | $7,180 | $314,125 | $63,938 | $250,187 |
| 2019 | $7,554 | $316,590 | $63,938 | $252,652 |
| 2018 | $7,309 | $302,551 | $63,938 | $238,613 |
| 2017 | $6,894 | $278,898 | $63,938 | $214,960 |
| 2016 | $6,737 | $253,627 | $63,938 | $189,689 |
| 2015 | $5,115 | $235,231 | $63,938 | $171,293 |
| 2014 | $5,115 | $204,450 | $64,868 | $139,582 |
| 2013 | -- | $200,626 | $38,239 | $162,387 |
Source: Public Records
Map
Nearby Homes
- 1012 Indian Ridge Dr
- 916 Smokerise Cir
- 720 Smokerise Cir
- 1108 Ellison Park Cir
- 1000 Lynhurst Ln
- 824 Sandpiper Dr
- 816 Chapel Dr
- 829 Skylark Dr
- 821 Sandpiper Dr
- 2009 Lake Fork Ct
- 2253 Hollyhill Ln
- 924 Ridgecrest Cir
- 2000 Lamprey Cir
- 2226 Savannah Trail
- 2272 Hollyhill Ln
- 2216 Jefferson Trail
- 2544 Natchez Trace
- 2209 Loon Lake Rd
- 2218 Southridge Dr
- 2312 Caddo Cir
- 709 Smokerise Cir
- 1005 Indian Ridge Dr
- 915 Smokerise Cir
- 1016 Indian Ridge Dr
- 1101 Indian Ridge Dr
- 1008 Indian Ridge Dr
- 704 Smokerise Cir
- 911 Smokerise Cir
- 713 Smokerise Cir
- 708 Smokerise Cir
- 1004 Indian Ridge Dr
- 907 Smokerise Cir
- 1100 Indian Ridge Dr
- 717 Smokerise Cir
- 1116 Chapel Dr
- 712 Smokerise Cir
- 1105 Indian Ridge Dr
- 903 Smokerise Cir
- 1117 Chapel Dr
- 1117 Bishops Park St