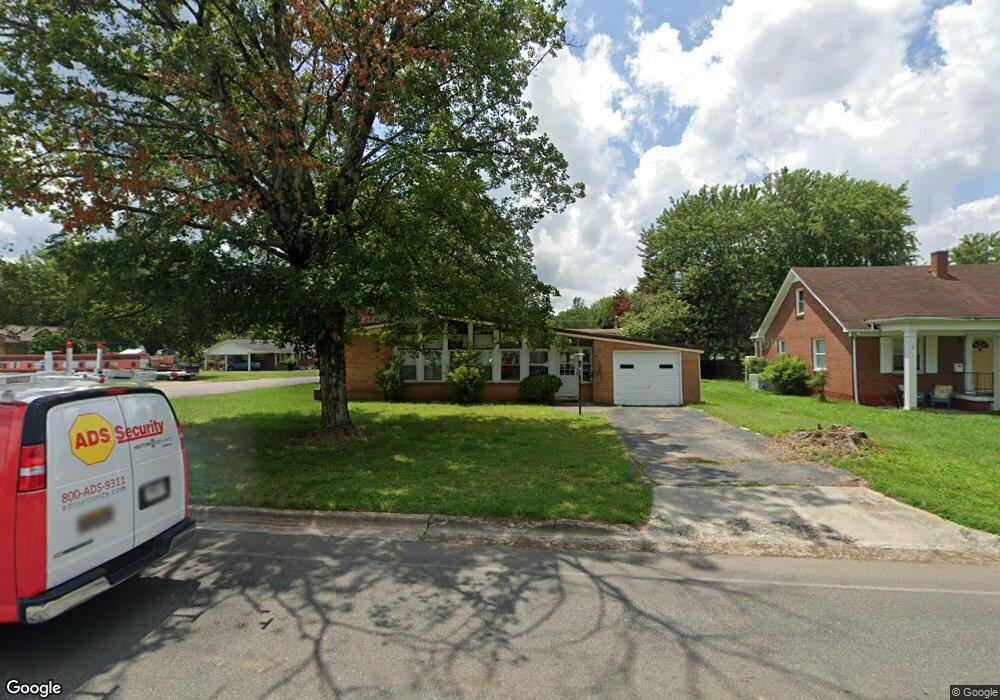
701 Springer Rd Lawrenceburg, TN 38464
Estimated Value: $208,000 - $261,000
--
Bed
2
Baths
2,051
Sq Ft
$116/Sq Ft
Est. Value
About This Home
This home is located at 701 Springer Rd, Lawrenceburg, TN 38464 and is currently estimated at $237,452, approximately $115 per square foot. 701 Springer Rd is a home located in Lawrence County with nearby schools including Ingram Sowell Elementary School, Lawrenceburg Public Elementary School, and David Crockett Elementary School.
Ownership History
Date
Name
Owned For
Owner Type
Purchase Details
Closed on
Nov 23, 2021
Sold by
Michaud Christopher L
Bought by
Winget Jay
Current Estimated Value
Purchase Details
Closed on
May 14, 2012
Sold by
Hines Dean Duane
Bought by
Michaud Christopher L
Home Financials for this Owner
Home Financials are based on the most recent Mortgage that was taken out on this home.
Original Mortgage
$41,600
Interest Rate
3.9%
Mortgage Type
Commercial
Purchase Details
Closed on
Jun 18, 2010
Sold by
Austin P
Bought by
Hines Steven S
Purchase Details
Closed on
Mar 8, 2000
Sold by
Greene Louise J
Bought by
Toungett Austin P
Purchase Details
Closed on
May 21, 1998
Bought by
Toungett Austin P & Louise J Revocable Living
Purchase Details
Closed on
Nov 30, 1994
Bought by
Greene Louise J
Purchase Details
Closed on
Jul 11, 1950
Bought by
Moore Thomas B and Moore Helen
Create a Home Valuation Report for This Property
The Home Valuation Report is an in-depth analysis detailing your home's value as well as a comparison with similar homes in the area
Home Values in the Area
Average Home Value in this Area
Purchase History
| Date | Buyer | Sale Price | Title Company |
|---|---|---|---|
| Winget Jay | $162,600 | None Available | |
| Michaud Christopher L | $52,000 | -- | |
| Hines Steven S | -- | -- | |
| Toungett Austin P | -- | -- | |
| Toungett Austin P & Louise J Revocable Living | -- | -- | |
| Greene Louise J | $67,500 | -- | |
| Moore Thomas B | -- | -- |
Source: Public Records
Mortgage History
| Date | Status | Borrower | Loan Amount |
|---|---|---|---|
| Previous Owner | Michaud Christopher L | $41,600 |
Source: Public Records
Tax History Compared to Growth
Tax History
| Year | Tax Paid | Tax Assessment Tax Assessment Total Assessment is a certain percentage of the fair market value that is determined by local assessors to be the total taxable value of land and additions on the property. | Land | Improvement |
|---|---|---|---|---|
| 2025 | $1,265 | $40,700 | $0 | $0 |
| 2024 | $1,265 | $40,700 | $2,500 | $38,200 |
| 2023 | $1,265 | $40,700 | $2,500 | $38,200 |
| 2022 | $1,265 | $40,700 | $2,500 | $38,200 |
| 2021 | $838 | $19,050 | $2,000 | $17,050 |
| 2020 | $838 | $19,050 | $2,000 | $17,050 |
| 2019 | $838 | $19,050 | $2,000 | $17,050 |
| 2018 | $838 | $19,050 | $2,000 | $17,050 |
| 2017 | $838 | $19,050 | $2,000 | $17,050 |
| 2016 | $838 | $19,050 | $2,000 | $17,050 |
| 2015 | $793 | $19,050 | $2,000 | $17,050 |
| 2014 | $810 | $19,450 | $2,000 | $17,450 |
Source: Public Records
Map
Nearby Homes