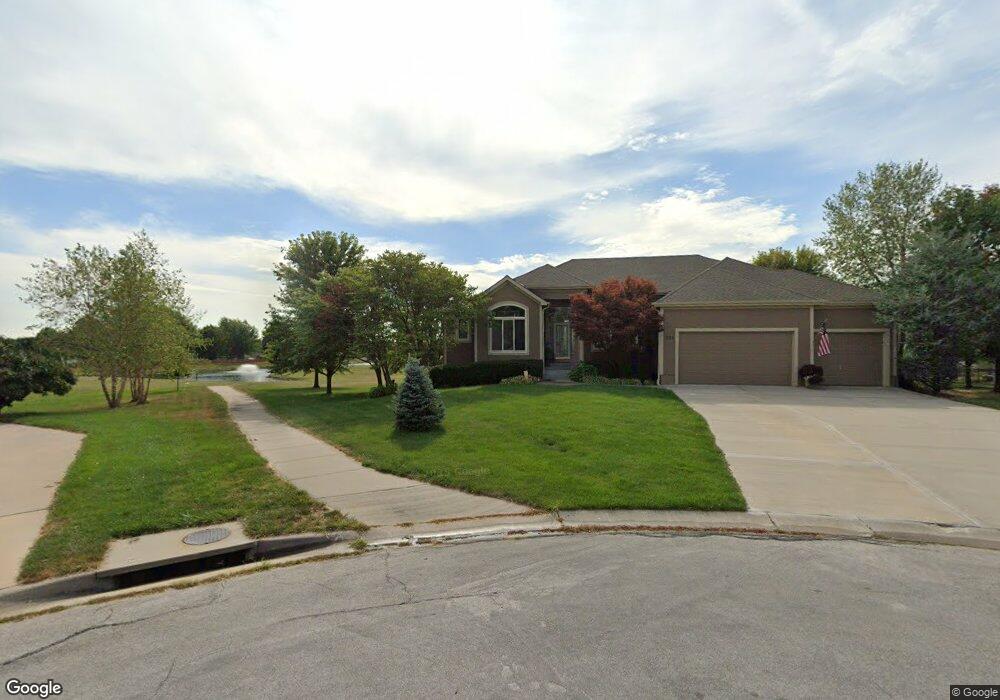
701 SW Admiral Byrd Ct Lees Summit, MO 64082
Estimated Value: $559,000 - $656,563
4
Beds
4
Baths
2,207
Sq Ft
$281/Sq Ft
Est. Value
About This Home
This home is located at 701 SW Admiral Byrd Ct, Lees Summit, MO 64082 and is currently estimated at $620,891, approximately $281 per square foot. 701 SW Admiral Byrd Ct is a home located in Cass County with nearby schools including Timber Creek Elementary School, Raymore-Peculiar East Middle School, and Raymore-Peculiar Senior High School.
Ownership History
Date
Name
Owned For
Owner Type
Purchase Details
Closed on
Jun 15, 2006
Sold by
Ty Construction & Residential Contractin
Bought by
Skeed Phillip A and Skeed Dana D
Current Estimated Value
Home Financials for this Owner
Home Financials are based on the most recent Mortgage that was taken out on this home.
Original Mortgage
$359,000
Outstanding Balance
$201,991
Interest Rate
6%
Mortgage Type
Adjustable Rate Mortgage/ARM
Estimated Equity
$418,900
Purchase Details
Closed on
Nov 1, 2005
Sold by
Raintree Lake Development Inc
Bought by
Ty Construction & Residential Contractin
Home Financials for this Owner
Home Financials are based on the most recent Mortgage that was taken out on this home.
Original Mortgage
$344,000
Interest Rate
6.04%
Mortgage Type
Construction
Create a Home Valuation Report for This Property
The Home Valuation Report is an in-depth analysis detailing your home's value as well as a comparison with similar homes in the area
Home Values in the Area
Average Home Value in this Area
Purchase History
| Date | Buyer | Sale Price | Title Company |
|---|---|---|---|
| Skeed Phillip A | -- | -- | |
| Ty Construction & Residential Contractin | -- | -- |
Source: Public Records
Mortgage History
| Date | Status | Borrower | Loan Amount |
|---|---|---|---|
| Open | Skeed Phillip A | $359,000 | |
| Previous Owner | Ty Construction & Residential Contractin | $344,000 |
Source: Public Records
Tax History Compared to Growth
Tax History
| Year | Tax Paid | Tax Assessment Tax Assessment Total Assessment is a certain percentage of the fair market value that is determined by local assessors to be the total taxable value of land and additions on the property. | Land | Improvement |
|---|---|---|---|---|
| 2025 | $5,975 | $98,020 | $12,790 | $85,230 |
| 2024 | $5,975 | $85,920 | $11,620 | $74,300 |
| 2023 | $5,953 | $85,920 | $11,620 | $74,300 |
| 2022 | $5,368 | $75,420 | $11,620 | $63,800 |
| 2021 | $5,368 | $75,420 | $11,620 | $63,800 |
| 2020 | $5,408 | $74,260 | $11,620 | $62,640 |
| 2019 | $5,291 | $74,260 | $11,620 | $62,640 |
| 2018 | $4,958 | $66,510 | $9,790 | $56,720 |
| 2017 | $4,537 | $66,510 | $9,790 | $56,720 |
| 2016 | $4,537 | $63,250 | $9,790 | $53,460 |
| 2015 | $4,535 | $63,250 | $9,790 | $53,460 |
| 2014 | $4,558 | $63,250 | $9,790 | $53,460 |
| 2013 | -- | $63,250 | $9,790 | $53,460 |
Source: Public Records
Map
Nearby Homes
- 4600 SW Admiral Byrd Dr
- 4641 SW Soldier Dr
- 4647 SW Olympia Place
- 917 SW Soldier Ct
- 4605 SW Olympia Cir
- 4628 SW Robinson Dr
- 4624 SW Robinson Dr
- 4528 SW Berkshire Dr
- 4520 SW Berkshire Dr
- 1021 SW Cheshire Dr
- 1022 SW Cheshire Dr
- 1100 SW Blackpool Dr
- 1128 SW Whitby Dr
- 1132 SW Whitby Dr
- 1136 SW Whitby Dr
- Cambridge Plan at Kensington Farms - Kennsington Farms
- Sonoma Plan at Kensington Farms - Kennsington Farms
- Danbury Plan at Kensington Farms - Kennsington Farms
- Fairfield Expanded Plan at Kensington Farms - Kennsington Farms
- Fairfield Plan at Kensington Farms - Kennsington Farms
- 705 SW Admiral Byrd Ct
- 700 SW Admiral Byrd Ct
- 728 SW Estates Dr
- 709 SW Admiral Byrd Ct
- 724 SW Estates Dr
- 704 SW Admiral Byrd Ct
- 732 SW Estates Dr
- 708 SW Admiral Byrd Ct
- 720 SW Estates Dr
- 736 SW Estates Dr
- 713 SW Admiral Byrd Ct
- 4525 SW Admiral Byrd Dr
- 716 SW Estates Dr
- 727 SW Estates Dr
- 740 SW Estates Dr
- 721 SW Estates Dr
- 735 SW Estates Dr
- 4536 SW Gull Point Dr
- 4532 SW Gull Point Dr
- 4540 SW Gull Point Dr