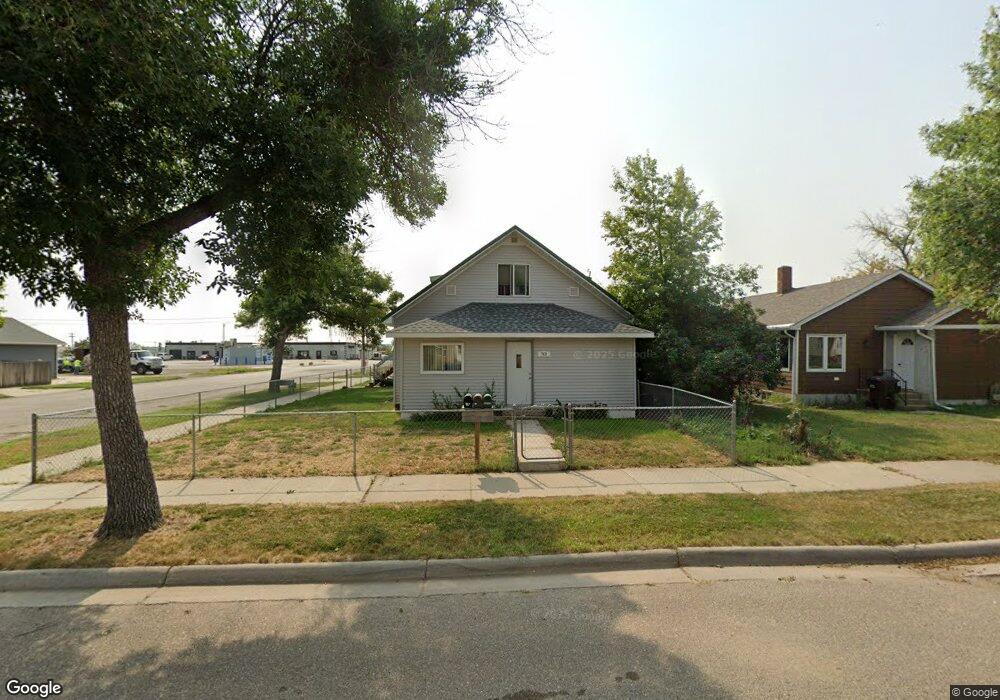
701 W Broadway Williston, ND 58801
Estimated Value: $261,000 - $325,234
4
Beds
2
Baths
1,624
Sq Ft
$178/Sq Ft
Est. Value
About This Home
This home is located at 701 W Broadway, Williston, ND 58801 and is currently estimated at $288,559, approximately $177 per square foot. 701 W Broadway is a home located in Williams County with nearby schools including Williston High School, St. Joseph Elementary School, and St. Josephs Elementary School.
Ownership History
Date
Name
Owned For
Owner Type
Purchase Details
Closed on
Jul 28, 2023
Sold by
Miller Diana L
Bought by
P & D Rentals Llc
Current Estimated Value
Purchase Details
Closed on
Oct 29, 2021
Sold by
Kitchens Travis J and Kitchens Kristina M
Bought by
Miller Scott
Home Financials for this Owner
Home Financials are based on the most recent Mortgage that was taken out on this home.
Original Mortgage
$193,065
Interest Rate
2.1%
Mortgage Type
Purchase Money Mortgage
Purchase Details
Closed on
Feb 23, 2010
Sold by
Levno Sherman E and Levno Vera F
Bought by
Kitchens Travis J and Kitchens Kristina M
Home Financials for this Owner
Home Financials are based on the most recent Mortgage that was taken out on this home.
Original Mortgage
$62,000
Interest Rate
5.11%
Mortgage Type
New Conventional
Create a Home Valuation Report for This Property
The Home Valuation Report is an in-depth analysis detailing your home's value as well as a comparison with similar homes in the area
Home Values in the Area
Average Home Value in this Area
Purchase History
| Date | Buyer | Sale Price | Title Company |
|---|---|---|---|
| P & D Rentals Llc | -- | Attorney Only | |
| Miller Scott | $265,000 | 701 Title | |
| Kitchens Travis J | $77,500 | None Available |
Source: Public Records
Mortgage History
| Date | Status | Borrower | Loan Amount |
|---|---|---|---|
| Previous Owner | Miller Scott | $193,065 | |
| Previous Owner | Kitchens Travis J | $62,000 |
Source: Public Records
Tax History Compared to Growth
Tax History
| Year | Tax Paid | Tax Assessment Tax Assessment Total Assessment is a certain percentage of the fair market value that is determined by local assessors to be the total taxable value of land and additions on the property. | Land | Improvement |
|---|---|---|---|---|
| 2024 | $2,418 | $141,705 | $19,250 | $122,455 |
| 2023 | $2,320 | $140,050 | $0 | $0 |
| 2022 | $1,944 | $114,265 | $0 | $0 |
| 2021 | $1,484 | $87,865 | $19,250 | $68,615 |
| 2020 | $1,516 | $91,050 | $19,250 | $71,800 |
| 2019 | $1,414 | $78,650 | $14,000 | $64,650 |
| 2018 | $1,367 | $76,700 | $8,750 | $67,950 |
| 2017 | $1,318 | $73,200 | $5,250 | $67,950 |
| 2016 | $1,404 | $94,850 | $5,250 | $89,600 |
| 2012 | -- | $41,300 | $2,650 | $38,650 |
Source: Public Records
Map
Nearby Homes