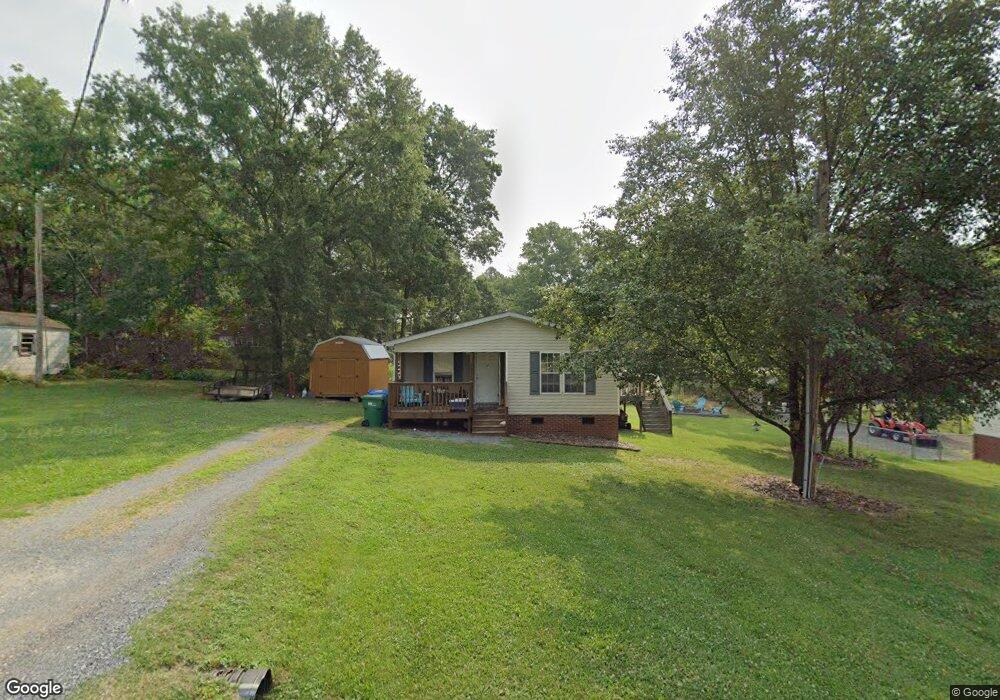
701 Williams Ave Albemarle, NC 28001
Estimated Value: $166,000 - $227,000
3
Beds
2
Baths
1,148
Sq Ft
$173/Sq Ft
Est. Value
About This Home
This home is located at 701 Williams Ave, Albemarle, NC 28001 and is currently estimated at $198,793, approximately $173 per square foot. 701 Williams Ave is a home located in Stanly County with nearby schools including Central Elementary School, Albemarle Middle School, and Albemarle High School.
Ownership History
Date
Name
Owned For
Owner Type
Purchase Details
Closed on
Jul 5, 2016
Sold by
Hatley Haley A
Bought by
Douglas Christopher
Current Estimated Value
Purchase Details
Closed on
Jan 1, 2010
Bought by
Hatley Haley Ann
Purchase Details
Closed on
Sep 24, 2009
Sold by
Citifinancial Inc
Bought by
Hatley Haley Ann
Home Financials for this Owner
Home Financials are based on the most recent Mortgage that was taken out on this home.
Original Mortgage
$50,900
Interest Rate
4.75%
Mortgage Type
New Conventional
Purchase Details
Closed on
Aug 13, 2009
Sold by
Paige Ira Reid and Paige Ashley Marie
Bought by
Citifinancial Inc
Home Financials for this Owner
Home Financials are based on the most recent Mortgage that was taken out on this home.
Original Mortgage
$50,900
Interest Rate
4.75%
Mortgage Type
New Conventional
Create a Home Valuation Report for This Property
The Home Valuation Report is an in-depth analysis detailing your home's value as well as a comparison with similar homes in the area
Home Values in the Area
Average Home Value in this Area
Purchase History
| Date | Buyer | Sale Price | Title Company |
|---|---|---|---|
| Douglas Christopher | $62,000 | Attorney | |
| Hatley Haley Ann | -- | -- | |
| Hatley Haley Ann | $51,000 | None Available | |
| Citifinancial Inc | $41,000 | None Available |
Source: Public Records
Mortgage History
| Date | Status | Borrower | Loan Amount |
|---|---|---|---|
| Previous Owner | Hatley Haley Ann | $50,900 |
Source: Public Records
Tax History Compared to Growth
Tax History
| Year | Tax Paid | Tax Assessment Tax Assessment Total Assessment is a certain percentage of the fair market value that is determined by local assessors to be the total taxable value of land and additions on the property. | Land | Improvement |
|---|---|---|---|---|
| 2025 | $1,461 | $130,484 | $24,494 | $105,990 |
| 2024 | $1,019 | $83,532 | $11,897 | $71,635 |
| 2023 | $1,019 | $83,532 | $11,897 | $71,635 |
| 2022 | $1,030 | $83,532 | $11,897 | $71,635 |
| 2021 | $1,030 | $83,532 | $11,897 | $71,635 |
| 2020 | $877 | $66,671 | $9,097 | $57,574 |
| 2019 | $886 | $66,671 | $9,097 | $57,574 |
| 2018 | $873 | $66,671 | $9,097 | $57,574 |
| 2017 | $840 | $66,671 | $9,097 | $57,574 |
| 2016 | $912 | $72,391 | $8,398 | $63,993 |
| 2015 | $914 | $71,782 | $8,398 | $63,384 |
| 2014 | $934 | $71,782 | $8,398 | $63,384 |
Source: Public Records
Map
Nearby Homes
- 623 Coble Ave
- 620 Central Ave
- 63 Calle de Castello Unit 6
- 00 NE Connector Bypass
- 0 Nc Hwy 24 27 Hwy
- 0 Monticello Dr
- 2012 Crown Point Dr
- 507 Wesley Heights Dr
- 601 Fernwood Dr
- 2100 Hillcrest Ave
- 504 Mount Vernon Dr
- 405 Wesley Heights Dr
- 1010 Harry Ct
- 211 S Slack St
- 205 S Slack St
- 2124 W Main St Unit C
- 2206 Hillcrest Ave
- 1806 Kingsley Dr
- 1002 Lorrie Ln Unit 284p
- 1610 Lowder St
- 703 Williams Ave
- 1225 Liberty Ave
- 1229 Liberty Ave
- 1221 Liberty Ave
- 616 Coble Ave
- 620 Coble Ave
- 1305 Hathcock Ave
- 1213 Liberty Ave
- 612 Williams Ave
- 614 Coble Ave
- 707 Williams Ave
- 608 Williams Ave
- 612 Coble Ave
- 1309 Hathcock Ave
- 702 Coble Ave
- 1211 Liberty Ave
- 522 Williams Ave
- 1310 Hathcock Ave
- 610 Coble Ave
- 615 Coble Ave