
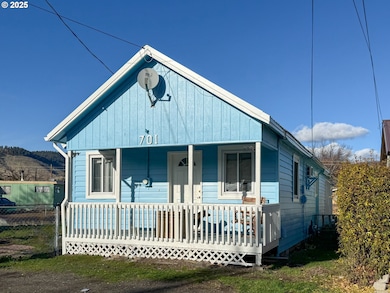
701 Y Ave La Grande, OR 97850
Estimated payment $1,153/month
Highlights
- Corner Lot
- Porch
- Bungalow
- No HOA
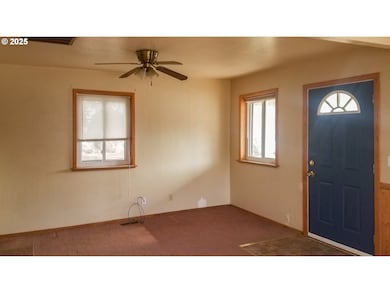
- Living Room
- Forced Air Heating System
About This Home
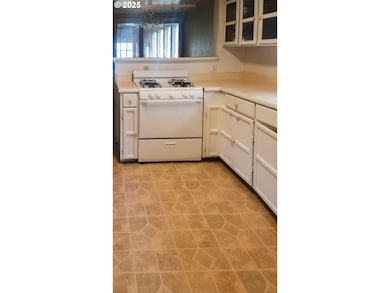
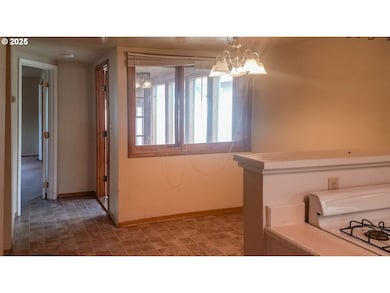
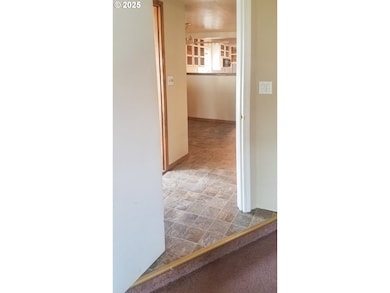
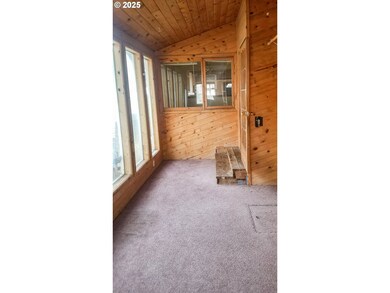
This 1915 bungalow has seen more than a century of life in La Grande and is ready for its next chapter. Sitting on a fenced corner lot with off-street parking, it offers 1,244 square feet, 2 bedrooms, 1 bathroom, and a sunroom for bonus living space.It’s not a polished package yet—this home needs some attention inside and out—but that’s exactly what makes it exciting. With solid bones, character worth saving, and updates already started (including a newer energy-efficient upgrades, including a new front window), the potential here is wide open.Whether you’re an investor looking for your next project or a buyer who wants to roll up your sleeves and create something just right for you, this property offers plenty of upside. Opportunities like this don’t come around often—schedule your showing and see the possibilities for yourself! Interior photos were taken prior to current occupant's arrival.
Listing Agent
RE/MAX Real Estate Team Brokerage Phone: 541-963-1000 License #201208312 Listed on: 08/27/2025

Home Details
Home Type
- Single Family
Est. Annual Taxes
- $1,528
Year Built
- Built in 1915
Lot Details
- 3,920 Sq Ft Lot
- Fenced
- Corner Lot
- Level Lot
- Property is zoned LG-R2
Parking
- Off-Street Parking
Home Design
- Bungalow
- Wood Siding
- Lap Siding
Interior Spaces
- 1,244 Sq Ft Home
- 1-Story Property
- Family Room
- Living Room
- Dining Room
Bedrooms and Bathrooms
- 2 Bedrooms
- 1 Full Bathroom
Outdoor Features
- Porch
Schools
- Greenwood Elementary School
- La Grande Middle School
- La Grande High School
Utilities
- No Cooling
- Forced Air Heating System
- Heating System Uses Gas
- Gas Water Heater
Community Details
- No Home Owners Association
Listing and Financial Details
- Assessor Parcel Number 1617
Map
Home Values in the Area
Average Home Value in this Area
Tax History
| Year | Tax Paid | Tax Assessment Tax Assessment Total Assessment is a certain percentage of the fair market value that is determined by local assessors to be the total taxable value of land and additions on the property. | Land | Improvement |
|---|---|---|---|---|
| 2025 | $1,582 | $87,440 | $35,440 | $52,000 |
| 2024 | $1,528 | $84,900 | $34,410 | $50,490 |
| 2023 | $1,502 | $82,430 | $33,410 | $49,020 |
| 2022 | $1,461 | $80,034 | $32,439 | $47,595 |
| 2021 | $1,424 | $77,703 | $31,927 | $45,776 |
| 2020 | $1,367 | $75,440 | $31,024 | $44,416 |
| 2019 | $1,339 | $73,243 | $30,312 | $42,931 |
| 2018 | $1,303 | $71,110 | $29,684 | $41,426 |
| 2017 | $1,220 | $69,039 | $24,037 | $45,002 |
| 2016 | $1,218 | $67,029 | $23,395 | $43,634 |
| 2015 | $1,142 | $65,077 | $22,625 | $42,452 |
| 2014 | $1,029 | $63,182 | $22,099 | $41,083 |
| 2013 | -- | $61,342 | $21,569 | $39,773 |
Property History
| Date | Event | Price | List to Sale | Price per Sq Ft |
|---|---|---|---|---|
| 08/27/2025 08/27/25 | For Sale | $195,000 | -- | $157 / Sq Ft |
Purchase History
| Date | Type | Sale Price | Title Company |
|---|---|---|---|
| Warranty Deed | $60,000 | Eastern Oregon Title Inc | |
| Trustee Deed | $77,350 | Abstract & Title Company | |
| Warranty Deed | $90,000 | Atco |
Mortgage History
| Date | Status | Loan Amount | Loan Type |
|---|---|---|---|
| Previous Owner | $91,800 | New Conventional |
Source: Regional Multiple Listing Service (RMLS)
MLS Number: 262335650
APN: 03S3806AD-1400-0-101
Disclaimer: Certain information contained herein is derived from information provided by parties other than Homes.com. All information provided is deemed reliable, but is not guaranteed to be accurate and should be independently verified.
![]() The content relating to real estate for sale on this web site comes in part from the IDX program of the RMLS™ of Portland, Oregon. Real estate listings held by brokerage firms other than Ten-X are marked with the RMLS™ logo, and detailed information about these properties includes the names of the listing brokers. Listing content is copyright © 2025 RMLS™, Portland, Oregon. Some properties which appear for sale on this web site may subsequently have sold or may no longer be available. All information provided is deemed reliable but is not guaranteed and should be independently verified.
The content relating to real estate for sale on this web site comes in part from the IDX program of the RMLS™ of Portland, Oregon. Real estate listings held by brokerage firms other than Ten-X are marked with the RMLS™ logo, and detailed information about these properties includes the names of the listing brokers. Listing content is copyright © 2025 RMLS™, Portland, Oregon. Some properties which appear for sale on this web site may subsequently have sold or may no longer be available. All information provided is deemed reliable but is not guaranteed and should be independently verified.
- 2702 N Oak St
- 703 Palmer Ave
- 705 Palmer Ave
- 701 Palmer Ave
- 1018 Y Ave
- 2203 Walnut St
- 2905 N Alder St
- 911 Division Ave
- 1012 Lake Ave
- 1018 Lake Ave
- 3103 N Walnut St
- 300 Grandy Ave
- 2708 N Depot St
- 3105 N Umatilla St
- 110 Lake Ave
- 0 N Umatilla St
- 308 Adams Ave
- 2417 N Fir St
- 15275 N Union St
- 2102 N Fir St