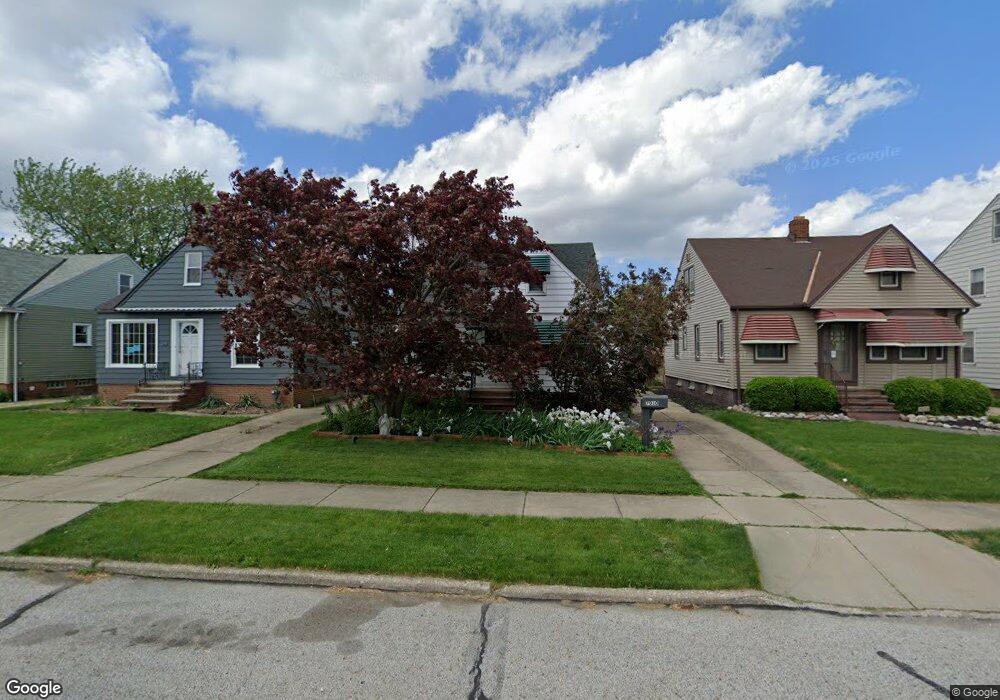
7010 Laverne Ave Cleveland, OH 44129
Estimated Value: $168,000 - $185,000
3
Beds
1
Bath
1,240
Sq Ft
$145/Sq Ft
Est. Value
About This Home
This home is located at 7010 Laverne Ave, Cleveland, OH 44129 and is currently estimated at $179,889, approximately $145 per square foot. 7010 Laverne Ave is a home located in Cuyahoga County with nearby schools including Thoreau Park Elementary School, Shiloh Middle School, and Greenbriar Middle School.
Ownership History
Date
Name
Owned For
Owner Type
Purchase Details
Closed on
Feb 22, 2000
Sold by
Close Alan L and Close Michelle L
Bought by
Mencke Stacie M
Current Estimated Value
Home Financials for this Owner
Home Financials are based on the most recent Mortgage that was taken out on this home.
Original Mortgage
$96,115
Outstanding Balance
$31,889
Interest Rate
8.21%
Mortgage Type
FHA
Estimated Equity
$148,000
Purchase Details
Closed on
Mar 28, 1994
Sold by
Belan Martin S
Bought by
Close Alan L
Purchase Details
Closed on
Jul 25, 1991
Sold by
Olejarski Lawrence J
Bought by
Belan Martin S
Purchase Details
Closed on
Aug 20, 1986
Sold by
Szucs Gene E
Bought by
Olejarski Lawrence J
Purchase Details
Closed on
Apr 2, 1985
Sold by
Szucs Linda C
Bought by
Szucs Gene E
Purchase Details
Closed on
Jan 1, 1975
Bought by
Szucs Linda C
Create a Home Valuation Report for This Property
The Home Valuation Report is an in-depth analysis detailing your home's value as well as a comparison with similar homes in the area
Home Values in the Area
Average Home Value in this Area
Purchase History
| Date | Buyer | Sale Price | Title Company |
|---|---|---|---|
| Mencke Stacie M | $97,000 | Executive Title Agency Corp | |
| Close Alan L | $77,000 | -- | |
| Belan Martin S | $70,000 | -- | |
| Olejarski Lawrence J | $52,000 | -- | |
| Szucs Gene E | -- | -- | |
| Szucs Linda C | -- | -- |
Source: Public Records
Mortgage History
| Date | Status | Borrower | Loan Amount |
|---|---|---|---|
| Open | Mencke Stacie M | $96,115 |
Source: Public Records
Tax History Compared to Growth
Tax History
| Year | Tax Paid | Tax Assessment Tax Assessment Total Assessment is a certain percentage of the fair market value that is determined by local assessors to be the total taxable value of land and additions on the property. | Land | Improvement |
|---|---|---|---|---|
| 2024 | $3,206 | $52,290 | $9,100 | $43,190 |
| 2023 | $2,846 | $39,800 | $7,320 | $32,480 |
| 2022 | $2,819 | $39,800 | $7,320 | $32,480 |
| 2021 | $2,898 | $39,800 | $7,320 | $32,480 |
| 2020 | $2,541 | $30,630 | $5,640 | $24,990 |
| 2019 | $2,430 | $87,500 | $16,100 | $71,400 |
| 2018 | $2,323 | $30,630 | $5,640 | $24,990 |
| 2017 | $2,363 | $27,620 | $4,830 | $22,790 |
| 2016 | $2,348 | $27,620 | $4,830 | $22,790 |
| 2015 | $2,236 | $27,620 | $4,830 | $22,790 |
| 2014 | $2,236 | $28,180 | $4,940 | $23,240 |
Source: Public Records
Map
Nearby Homes
- 6606 Theota Ave
- 6211 Luelda Ave
- 7707 Liberty Ave
- 6014 Laverne Ave
- 5906 Velma Ave
- 5810 Laverne Ave
- 6011 Theota Ave
- 5618 Bradley Ave
- 8206 Newport Ave
- 5511 Velma Ave
- 5406 Merkle Ave
- 8018 Pinegrove Ave
- 6306 Flowerdale Ave
- 5815 Westlake Ave
- 6508 Delora Ave
- 6903 Forest Ave
- 7609 Wooster Pkwy
- 6711 Forest Ave
- 8119 Pinegrove Ave
- 5637 Flowerdale Ave
- 7014 Laverne Ave
- 7006 Laverne Ave
- 7102 Laverne Ave
- 7002 Laverne Ave
- 7015 Luelda Ave
- 7011 Luelda Ave
- 7106 Laverne Ave
- 6916 Laverne Ave
- 7103 Luelda Ave
- 7007 Luelda Ave
- 7003 Luelda Ave
- 7110 Laverne Ave
- 7007 Laverne Ave
- 7003 Laverne Ave
- 7011 Laverne Ave
- 7111 Luelda Ave
- 6915 Luelda Ave
- 6912 Laverne Ave
- 7114 Laverne Ave
- 7103 Laverne Ave