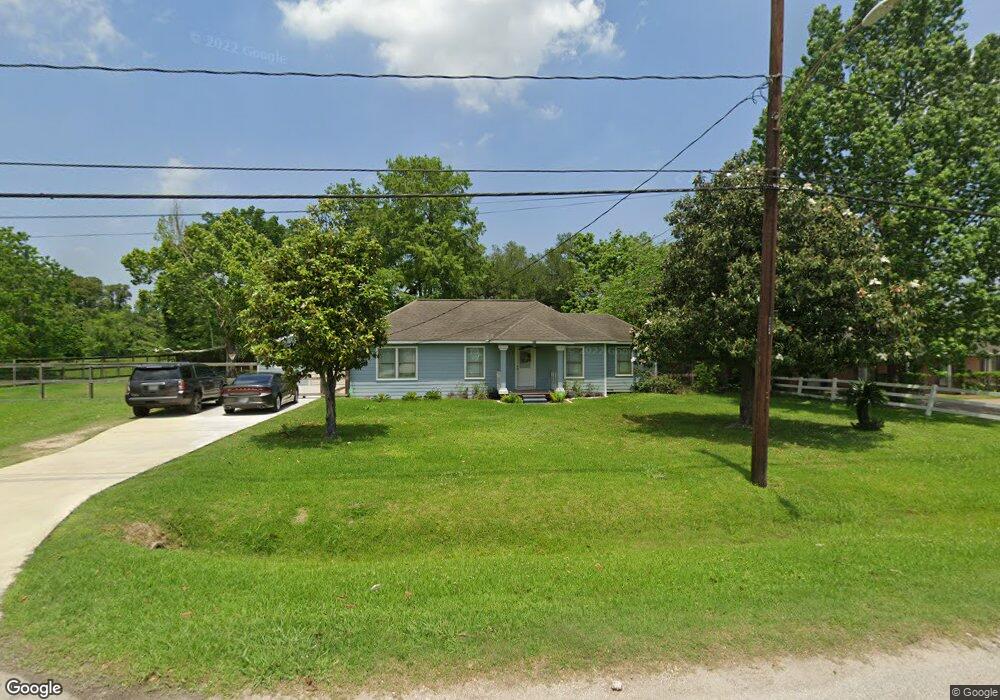
7011 Banyan St Houston, TX 77028
Trinity-Houston Gardens NeighborhoodEstimated Value: $131,000 - $181,000
2
Beds
1
Bath
1,116
Sq Ft
$139/Sq Ft
Est. Value
About This Home
This home is located at 7011 Banyan St, Houston, TX 77028 and is currently estimated at $154,654, approximately $138 per square foot. 7011 Banyan St is a home located in Harris County with nearby schools including McGowen Elementary School, Key Middle, and Kashmere High School.
Ownership History
Date
Name
Owned For
Owner Type
Purchase Details
Closed on
Oct 7, 2002
Sold by
Hud
Bought by
Lozano Eliud
Current Estimated Value
Home Financials for this Owner
Home Financials are based on the most recent Mortgage that was taken out on this home.
Original Mortgage
$56,050
Outstanding Balance
$23,567
Interest Rate
6.2%
Estimated Equity
$131,087
Purchase Details
Closed on
Nov 2, 2001
Sold by
Chase Manhattan Mtg Corp
Bought by
Hud
Purchase Details
Closed on
Sep 4, 2001
Sold by
Sowell Judy L and Sowell Marvin G
Bought by
Chase Manhattan Mtg Corp
Purchase Details
Closed on
Jan 18, 2000
Sold by
Washington Doris Gibbs
Bought by
Sowell Judy L
Home Financials for this Owner
Home Financials are based on the most recent Mortgage that was taken out on this home.
Original Mortgage
$52,566
Interest Rate
7.86%
Mortgage Type
FHA
Create a Home Valuation Report for This Property
The Home Valuation Report is an in-depth analysis detailing your home's value as well as a comparison with similar homes in the area
Home Values in the Area
Average Home Value in this Area
Purchase History
| Date | Buyer | Sale Price | Title Company |
|---|---|---|---|
| Lozano Eliud | -- | First American Title | |
| Hud | -- | Alamo Title Company | |
| Chase Manhattan Mtg Corp | $57,893 | -- | |
| Sowell Judy L | -- | Texas American Title Company |
Source: Public Records
Mortgage History
| Date | Status | Borrower | Loan Amount |
|---|---|---|---|
| Open | Lozano Eliud | $56,050 | |
| Previous Owner | Sowell Judy L | $52,566 |
Source: Public Records
Tax History Compared to Growth
Tax History
| Year | Tax Paid | Tax Assessment Tax Assessment Total Assessment is a certain percentage of the fair market value that is determined by local assessors to be the total taxable value of land and additions on the property. | Land | Improvement |
|---|---|---|---|---|
| 2025 | $762 | $136,621 | $63,291 | $73,330 |
| 2024 | $762 | $120,727 | $57,215 | $63,512 |
| 2023 | $762 | $97,004 | $50,633 | $46,371 |
| 2022 | $1,412 | $76,817 | $35,443 | $41,374 |
| 2021 | $1,359 | $58,295 | $22,278 | $36,017 |
| 2020 | $1,319 | $57,820 | $22,278 | $35,542 |
| 2019 | $1,253 | $58,291 | $22,278 | $36,013 |
| 2018 | $613 | $46,662 | $22,278 | $24,384 |
| 2017 | $1,034 | $46,662 | $22,278 | $24,384 |
| 2016 | $940 | $46,662 | $22,278 | $24,384 |
| 2015 | $518 | $33,812 | $4,219 | $29,593 |
| 2014 | $518 | $33,812 | $4,219 | $29,593 |
Source: Public Records
Map
Nearby Homes
- 0 Kittridge
- 7204 Homestead Rd
- 6909 Kittridge St
- 6729 Kittridge St
- 6911 Finch St
- 6907 Finch St
- 0 Landor
- 6714 E Crosstimbers
- 6908 Larkstone St
- 6601 Landor St
- 7002 Jay St
- 5409-5417 Carey St
- 6719 Roanoke St
- 6705 Roanoke St
- 7140 Orville St
- 6606 Weaver Rd
- 6942 Peyton St
- 0 Shreveport Blvd
- 6842 Carothers St
- 6838 Carothers St