Estimated Value: $745,000 - $776,000
5
Beds
6
Baths
2,744
Sq Ft
$278/Sq Ft
Est. Value
About This Home
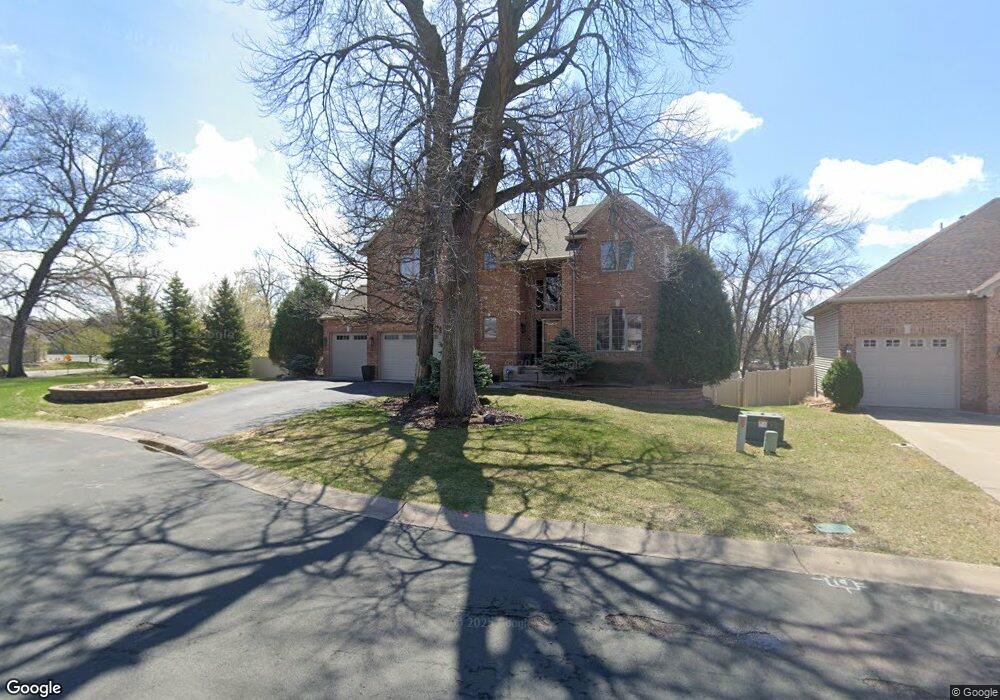
This home is located at 7015 Terraceview Ln N, Osseo, MN 55311 and is currently estimated at $763,909, approximately $278 per square foot. 7015 Terraceview Ln N is a home located in Hennepin County with nearby schools including Basswood Elementary School, Maple Grove Middle School, and Maple Grove Senior High School.
Ownership History
Date
Name
Owned For
Owner Type
Purchase Details
Closed on
Mar 12, 2008
Sold by
National Residential Nominee Services In
Bought by
Overskei Chad and Overskei Melanie
Current Estimated Value
Purchase Details
Closed on
Dec 8, 2006
Sold by
Mattison Lydia N and Mattison Clifton D
Bought by
National Residential Nominee Svcs Inc
Purchase Details
Closed on
Mar 26, 2004
Sold by
Eggleston Kent R and Eggleston Huijing
Bought by
Mattison Lydia N and Mattison Clifton D
Purchase Details
Closed on
May 9, 2002
Sold by
Heritage Home Builders Inc
Bought by
Eggleston Kent R and Eggleston Huijing
Create a Home Valuation Report for This Property
The Home Valuation Report is an in-depth analysis detailing your home's value as well as a comparison with similar homes in the area
Home Values in the Area
Average Home Value in this Area
Purchase History
| Date | Buyer | Sale Price | Title Company |
|---|---|---|---|
| Overskei Chad | $450,000 | -- | |
| National Residential Nominee Svcs Inc | $632,500 | -- | |
| Mattison Lydia N | $532,500 | -- | |
| Eggleston Kent R | $426,507 | -- |
Source: Public Records
Tax History Compared to Growth
Tax History
| Year | Tax Paid | Tax Assessment Tax Assessment Total Assessment is a certain percentage of the fair market value that is determined by local assessors to be the total taxable value of land and additions on the property. | Land | Improvement |
|---|---|---|---|---|
| 2024 | $8,741 | $682,200 | $159,100 | $523,100 |
| 2023 | $8,429 | $682,800 | $159,100 | $523,700 |
| 2022 | $6,670 | $655,000 | $117,300 | $537,700 |
| 2021 | $6,557 | $541,100 | $92,300 | $448,800 |
| 2020 | $6,473 | $526,000 | $87,300 | $438,700 |
| 2019 | $6,892 | $498,000 | $85,000 | $413,000 |
| 2018 | $6,826 | $500,400 | $99,000 | $401,400 |
| 2017 | $6,972 | $476,000 | $109,000 | $367,000 |
| 2016 | $7,131 | $480,000 | $119,000 | $361,000 |
| 2015 | $7,213 | $472,300 | $129,000 | $343,300 |
| 2014 | -- | $428,000 | $120,000 | $308,000 |
Source: Public Records
Map
Nearby Homes
- 7082 Weston Ln N
- 7094 Weston Ln N
- 7099 Weston Ln N
- 6848 Polaris Ln N
- 7244 Quantico Ln N
- 7261 Quantico Ln N
- 16236 70th Place N
- 15097 67th Place N
- 16314 70th Ave N
- 15770 73rd Place N
- 16322 70th Ave N Unit 204
- 7453 Mariner Dr
- 7585 Lanewood Ln N
- 7071 Empire Ln N
- 6386 Minnesota Ln N
- 7720 Niagara Ln N
- 6413 Archer Ln N
- 6726 Fountain Ln N
- 6336 Yuma Ln N
- 17225 72nd Ave N Unit 2001
- 7027 Terraceview Ln N
- 7039 Terraceview Ln N
- 7046 Terraceview Ln N
- 7018 Terraceview Ln N
- 7010 Terraceview Ln N
- 15476 70th Ave N
- 15464 70th Ave N
- 15475 70th Ave N
- 15463 15463 70th-Avenue-n
- 6985 W Fish Lake Rd
- 15452 70th Ave N
- 7074 Terraceview Ln N
- 15463 70th Ave N
- 15452 15452 70th-Avenue-n
- 15451 15451 70th-Avenue-n
- 15440 70th Ave N
- 15451 70th Ave N
- 7063 Terraceview Ln N
- 7086 Terraceview Ln N
- 15559 71st Ave N