

7015 W 700 N Winamac, IN 46996
Estimated payment $2,086/month
Total Views
1,412
3
Beds
2.5
Baths
1,720
Sq Ft
$209
Price per Sq Ft
Highlights
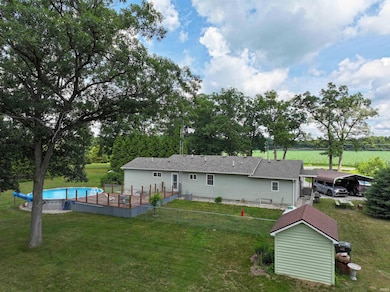
- Above Ground Pool
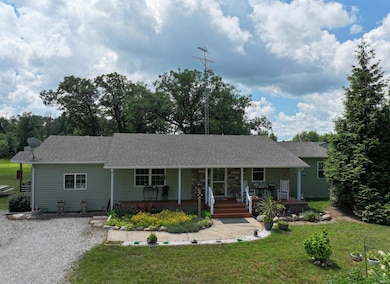
- Ranch Style House
- Stone Countertops
- Primary Bedroom Suite
- Great Room
- Covered patio or porch
About This Home
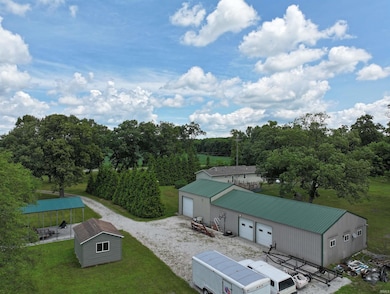
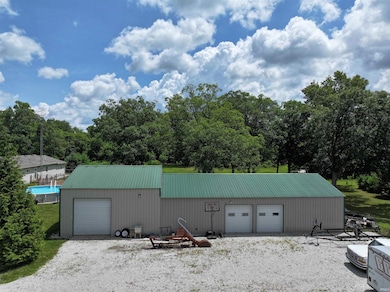
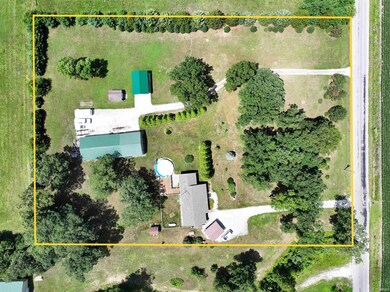
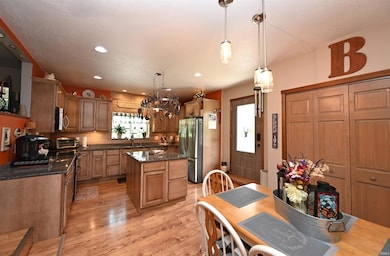
Discover Your Dream 3-Acre Country Oasis! Everything you've ever wished for awaits you in this stunning one-story home featuring three bedrooms and two and a half bathrooms, all move-in ready! Enjoy the impressive 30 x 81 finished pole barn, complete with a workshop! Delight in cooking within the spacious kitchen, boasting custom cabinets, stainless steel appliances, and elegant granite countertops. The expansive living room flows seamlessly into the kitchen, making it ideal for entertaining. Feel like royalty as you enter the primary bedroom suite, which includes a walk-in closet and a spacious bathroom with a walk-in shower. The second bedroom also offers an attached bathroom, ensuring that your overnight guests feel right at home. Step into the backyard, where you'll find an outdoor paradise featuring an above-ground pool, ample space for gardening, room to ride ATVs, a pole barn perfect for hobbies, a home business, or hosting parties!
Home Details
Home Type
- Single Family
Est. Annual Taxes
- $1,100
Year Built
- Built in 1995
Lot Details
- 3 Acre Lot
- Lot Dimensions are 295 x 440
- Rural Setting
- Landscaped
- Level Lot
Parking
- 1 Car Garage
- Carport
- Garage Door Opener
- Gravel Driveway
- Off-Street Parking
Home Design
- Ranch Style House
- Poured Concrete
- Vinyl Construction Material
Interior Spaces
- 1,720 Sq Ft Home
- Ceiling Fan
- Great Room
- Ceramic Tile Flooring
- Crawl Space
- Laundry on main level
Kitchen
- Eat-In Kitchen
- Stone Countertops
Bedrooms and Bathrooms
- 3 Bedrooms
- Primary Bedroom Suite
- Split Bedroom Floorplan
- Walk-In Closet
- <<tubWithShowerToken>>
Outdoor Features
- Above Ground Pool
- Covered patio or porch
Schools
- North Judson - San Pierre Elementary School
- North Judson-San Pierre Middle School
- North Judson-San Pierre High School
Utilities
- Forced Air Heating and Cooling System
- Propane
- Private Company Owned Well
- Well
- Septic System
Community Details
- Community Pool
Listing and Financial Details
- Assessor Parcel Number 66-03-10-100-023.000-012
Map
Create a Home Valuation Report for This Property
The Home Valuation Report is an in-depth analysis detailing your home's value as well as a comparison with similar homes in the area
Home Values in the Area
Average Home Value in this Area
Tax History
| Year | Tax Paid | Tax Assessment Tax Assessment Total Assessment is a certain percentage of the fair market value that is determined by local assessors to be the total taxable value of land and additions on the property. | Land | Improvement |
|---|---|---|---|---|
| 2024 | $1,049 | $168,200 | $41,600 | $126,600 |
| 2023 | $954 | $153,200 | $26,500 | $126,700 |
| 2022 | $960 | $140,200 | $23,500 | $116,700 |
| 2021 | $970 | $129,800 | $19,000 | $110,800 |
| 2020 | $891 | $128,200 | $18,600 | $109,600 |
| 2019 | $535 | $105,700 | $18,600 | $87,100 |
| 2018 | $552 | $104,200 | $16,300 | $87,900 |
| 2017 | $577 | $112,900 | $16,300 | $96,600 |
| 2016 | $903 | $134,400 | $14,700 | $119,700 |
| 2014 | $788 | $129,900 | $14,700 | $115,200 |
| 2013 | $788 | $130,400 | $14,700 | $115,700 |
Source: Public Records
Property History
| Date | Event | Price | Change | Sq Ft Price |
|---|---|---|---|---|
| 07/01/2025 07/01/25 | For Sale | $360,000 | -- | $209 / Sq Ft |
Source: Indiana Regional MLS
Purchase History
| Date | Type | Sale Price | Title Company |
|---|---|---|---|
| Warranty Deed | -- | None Available |
Source: Public Records
Mortgage History
| Date | Status | Loan Amount | Loan Type |
|---|---|---|---|
| Open | $123,500 | Stand Alone Refi Refinance Of Original Loan | |
| Closed | $126,400 | Stand Alone Refi Refinance Of Original Loan | |
| Closed | $113,600 | New Conventional | |
| Closed | $118,250 | New Conventional | |
| Closed | $6,600 | New Conventional |
Source: Public Records
Similar Homes in Winamac, IN
Source: Indiana Regional MLS
MLS Number: 202525297
APN: 66-03-10-100-023.000-012
Disclaimer: Certain information contained herein is derived from information provided by parties other than Homes.com. All information provided is deemed reliable, but is not guaranteed to be accurate and should be independently verified.
![]() IDX information is provided exclusively for personal, non-commercial use, and may not be used for any purpose other than to identify prospective properties consumers may be interested in purchasing. Information is deemed reliable but not guaranteed.
IDX information is provided exclusively for personal, non-commercial use, and may not be used for any purpose other than to identify prospective properties consumers may be interested in purchasing. Information is deemed reliable but not guaranteed.
Nearby Homes
- 7344 W 500 N
- 3092 W 800 S
- 833 E 800 S
- 2835 W 625 S
- 2480 W State Road 10
- 6175 S Oakwood Ave
- 900 W S of River
- 0 Simmons St
- 2674 W Southside Pkwy
- 204 N George St
- 205 George St
- 408 Keller Ave
- 201 Sheridan Ave
- 502 Keller Ave
- 203 W Vine St
- 4968 W Campbell St
- 610 Arlington Ave
- 6155 S John St
- 108 Lincoln Ave
- 2600 W 1st Ave
- 406 W Indiana St Unit B-4
- 406 W Indiana St Unit B-4
- 412 11th Cir SE Unit Iron Lake Estates
- 1645 N McCade St
- 1340 Holloway Dr
- 600 Randolph Dr
- 2234 Bitter Root Dr
- 201 Sturdy Rd
- 1401 Lincolnway
- 2210 Beech St
- 820 Brown St
- 502 Sturdy Rd
- 357 S Greenwich St Unit 6
- 357 Greenwich St Unit 6
- 364 College Ave Unit 2nd Floor Unit
- 355 College Ave
- 1715 Lake Michigan Dr
- 353 Morgan Blvd Unit 2
- 357 Franklin St Unit ID1255139P
- 706 Chicago St Unit 1