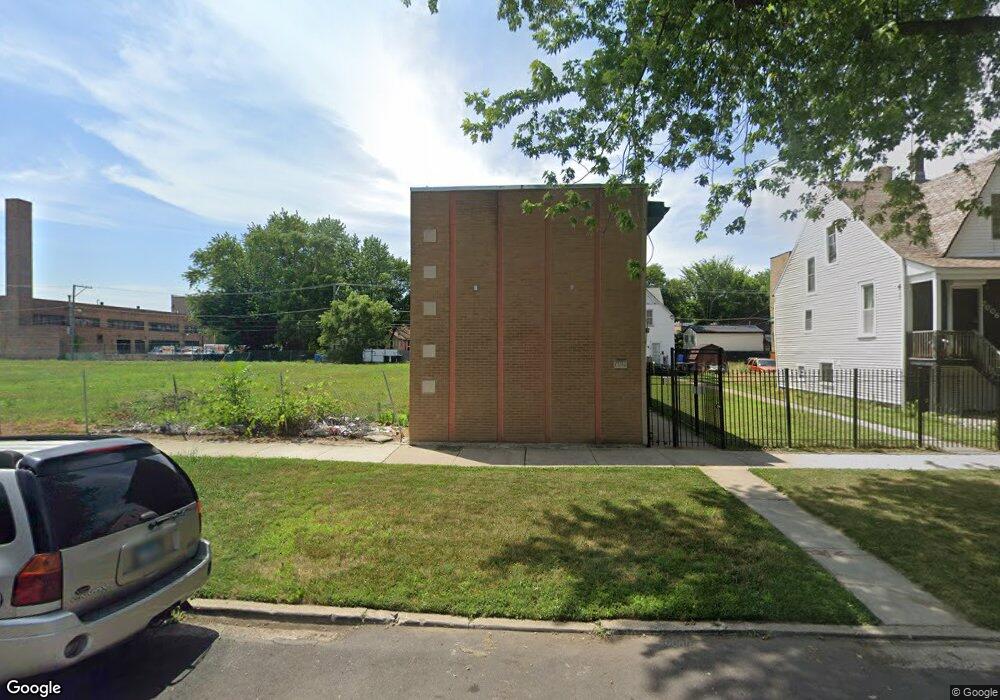
7016 S East End Ave Chicago, IL 60649
South Shore NeighborhoodEstimated Value: $184,000
--
Bed
--
Bath
--
Sq Ft
8,146
Sq Ft Lot
About This Home
This home is located at 7016 S East End Ave, Chicago, IL 60649 and is currently estimated at $184,000. 7016 S East End Ave is a home located in Cook County with nearby schools including Parkside Elementary Community Academy, Hyde Park Academy High School, and Muhammad University.
Ownership History
Date
Name
Owned For
Owner Type
Purchase Details
Closed on
May 12, 2015
Sold by
Zlc Investments Llc
Bought by
7016 S East End Corp
Current Estimated Value
Purchase Details
Closed on
Jul 23, 2012
Sold by
Chicago Title Land Trust Co
Bought by
Zlc Investments Llc
Purchase Details
Closed on
Aug 18, 2005
Sold by
Highland Luxury Condos Llc
Bought by
Kassam Kabir S and Devani Kashif
Home Financials for this Owner
Home Financials are based on the most recent Mortgage that was taken out on this home.
Original Mortgage
$119,900
Interest Rate
5.89%
Mortgage Type
Fannie Mae Freddie Mac
Purchase Details
Closed on
Nov 20, 2003
Sold by
Interpacifica Construction Inc
Bought by
Harris Trust & Savings Bank and Trust #Htb-1413
Purchase Details
Closed on
Nov 3, 1997
Sold by
City Of Chicago
Bought by
Interpacifica Construction Inc
Purchase Details
Closed on
Nov 28, 1996
Sold by
South Shore Community Church
Bought by
The City Of Chicago
Create a Home Valuation Report for This Property
The Home Valuation Report is an in-depth analysis detailing your home's value as well as a comparison with similar homes in the area
Home Values in the Area
Average Home Value in this Area
Purchase History
| Date | Buyer | Sale Price | Title Company |
|---|---|---|---|
| 7016 S East End Corp | $155,000 | Stewart Title | |
| Zlc Investments Llc | -- | None Available | |
| Kassam Kabir S | $120,000 | Pntn | |
| Harris Trust & Savings Bank | $100,000 | -- | |
| Interpacifica Construction Inc | $20,315 | -- | |
| The City Of Chicago | -- | -- |
Source: Public Records
Mortgage History
| Date | Status | Borrower | Loan Amount |
|---|---|---|---|
| Previous Owner | Kassam Kabir S | $119,900 |
Source: Public Records
Tax History Compared to Growth
Tax History
| Year | Tax Paid | Tax Assessment Tax Assessment Total Assessment is a certain percentage of the fair market value that is determined by local assessors to be the total taxable value of land and additions on the property. | Land | Improvement |
|---|---|---|---|---|
| 2024 | $1,553 | $6,114 | $6,113 | $1 |
| 2023 | $1,509 | $7,336 | $7,335 | $1 |
| 2022 | $1,509 | $7,336 | $7,335 | $1 |
| 2021 | $1,475 | $7,336 | $7,335 | $1 |
| 2020 | $1,634 | $7,336 | $7,335 | $1 |
| 2019 | $1,474 | $7,336 | $7,335 | $1 |
| 2018 | $1,449 | $7,336 | $7,335 | $1 |
| 2017 | $1,404 | $6,521 | $6,520 | $1 |
| 2016 | $1,306 | $6,521 | $6,520 | $1 |
| 2015 | $1,195 | $6,521 | $6,520 | $1 |
| 2014 | $1,059 | $5,706 | $5,705 | $1 |
| 2013 | $1,038 | $5,706 | $5,705 | $1 |
Source: Public Records
Map
Nearby Homes
- 7010 S East End Ave Unit 4
- 7008 S East End Ave
- 7000 S East End Ave Unit 303
- 1715 E 70th St
- 7030 S Cregier Ave
- 1619 E 70th St
- 6907 S Cornell Ave
- 7125 S Cornell Ave
- 7821 S Stony Island Ave
- 7018 S Stony Island Ave
- 1757 E 71st Place
- 6843 S Cornell Ave
- 7150 S Cornell Ave
- 1758 E 72nd St
- 7049 S Harper Ave
- 6835 S Cornell Ave Unit 2S
- 7242 S East End Ave
- 7246 S East End Ave
- 6943 S Euclid Ave
- 7251 S Ridgeland Ave Unit E
- 7010 S East End Ave Unit 5
- 7010 S East End Ave Unit 2
- 7010 S East End Ave Unit 3
- 7010 S East End Ave Unit 1
- 7006 S East End Ave
- 7000 S East End Ave Unit 106
- 7000 S East End Ave Unit 305
- 7000 S East End Ave Unit 301
- 7000 S East End Ave Unit 201
- 7000 S East End Ave Unit 104
- 7000 S East End Ave Unit 304
- 7000 S East End Ave Unit 202
- 7000 S East End Ave Unit 203
- 7000 S East End Ave Unit 101
- 7000 S East End Ave Unit 105
- 7000 S East End Ave Unit 302
- 7000 S East End Ave Unit 309
- 7000 S East End Ave Unit 102
- 7000 S East End Ave Unit 307
- 7000 S East End Ave Unit 306