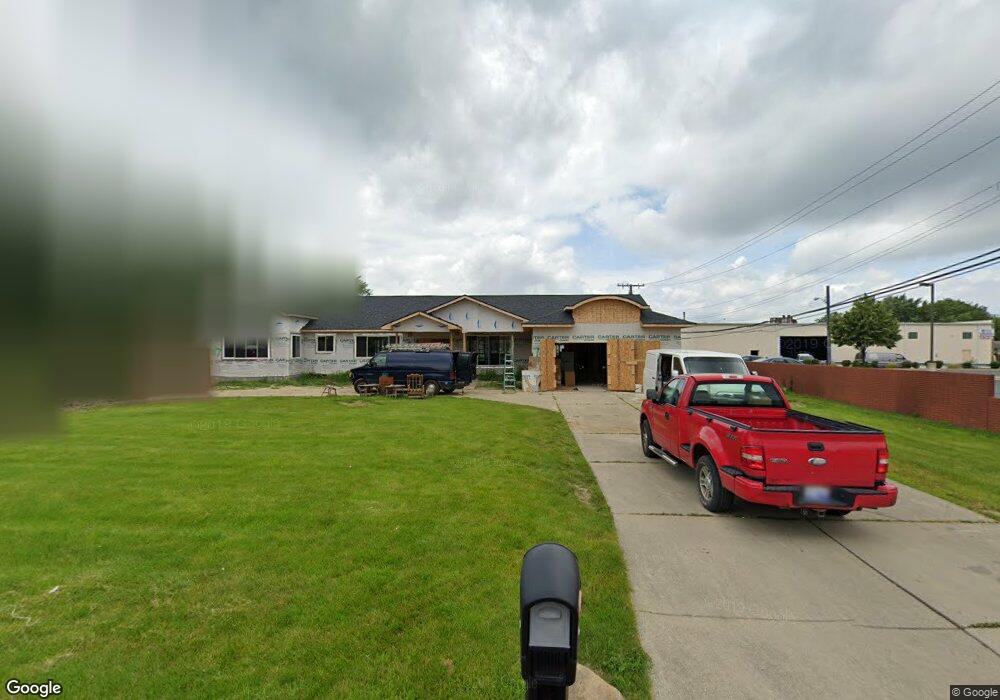
7017 Fairwood Dr Unit Bldg-Unit Dearborn Heights, MI 48127
Estimated Value: $572,000 - $942,000
4
Beds
5
Baths
3,872
Sq Ft
$212/Sq Ft
Est. Value
About This Home
This home is located at 7017 Fairwood Dr Unit Bldg-Unit, Dearborn Heights, MI 48127 and is currently estimated at $822,002, approximately $212 per square foot. 7017 Fairwood Dr Unit Bldg-Unit is a home located in Wayne County with nearby schools including Crestwood High School, Riverside Middle School, and Kinloch Elementary School.
Ownership History
Date
Name
Owned For
Owner Type
Purchase Details
Closed on
Sep 20, 2021
Sold by
Ozeir Nada
Bought by
Ozeir Nada and Kanouno Paul D
Current Estimated Value
Home Financials for this Owner
Home Financials are based on the most recent Mortgage that was taken out on this home.
Original Mortgage
$1,040,000
Outstanding Balance
$943,626
Interest Rate
2.61%
Mortgage Type
New Conventional
Estimated Equity
-$121,624
Purchase Details
Closed on
Sep 2, 2020
Sold by
Ozeir Nada
Bought by
Ozeir Nada and Ozeir Nada
Purchase Details
Closed on
Dec 22, 2017
Sold by
Jawor Frank C and Jawor Carol M
Bought by
Ozeir Nada
Purchase Details
Closed on
Nov 19, 2010
Sold by
Jawor Frank C and Jawor John J
Bought by
Jawor John J
Purchase Details
Closed on
Oct 16, 2003
Sold by
Jawor Frank L and Jawor Helen
Bought by
Jawor Francis L
Create a Home Valuation Report for This Property
The Home Valuation Report is an in-depth analysis detailing your home's value as well as a comparison with similar homes in the area
Home Values in the Area
Average Home Value in this Area
Purchase History
| Date | Buyer | Sale Price | Title Company |
|---|---|---|---|
| Ozeir Nada | -- | Hbi Title Services Inc | |
| Ozeir Nada | -- | None Available | |
| Ozeir Nada | $282,000 | Embassy Title Agency Inc | |
| Jawor John J | -- | None Available | |
| Jawor Francis L | -- | -- |
Source: Public Records
Mortgage History
| Date | Status | Borrower | Loan Amount |
|---|---|---|---|
| Open | Ozeir Nada | $1,040,000 |
Source: Public Records
Tax History Compared to Growth
Tax History
| Year | Tax Paid | Tax Assessment Tax Assessment Total Assessment is a certain percentage of the fair market value that is determined by local assessors to be the total taxable value of land and additions on the property. | Land | Improvement |
|---|---|---|---|---|
| 2025 | $12,759 | $452,500 | $0 | $0 |
| 2024 | $12,759 | $448,700 | $0 | $0 |
| 2023 | $12,061 | $424,600 | $0 | $0 |
| 2022 | $16,328 | $387,700 | $0 | $0 |
| 2021 | $15,488 | $356,900 | $0 | $0 |
| 2019 | $8,959 | $146,200 | $0 | $0 |
| 2018 | $6,655 | $147,700 | $0 | $0 |
| 2017 | $4,987 | $144,300 | $0 | $0 |
| 2016 | $7,368 | $143,000 | $0 | $0 |
| 2015 | $11,675 | $136,700 | $0 | $0 |
| 2013 | $11,310 | $115,600 | $0 | $0 |
| 2010 | -- | $119,500 | $0 | $0 |
Source: Public Records
Map
Nearby Homes
- 7370 Amboy St
- 7350 N Inkster Rd Unit 17
- 7350 N Inkster Rd
- 7029 Belton St
- 7367 Cavell St
- 6701 Rosemary St
- 27517 Windsor St
- 7641 N Inkster Rd
- 26511 W Warren St
- 7606 Cavell St
- 7048 Deering St
- 7241 Lucerne St
- 27023 Clairview Dr
- 27047 Clairview Dr
- 6567 Sterling Ct
- 6690 Deering St
- 27418 Maplewood St
- 7401 Floral St
- 7304 Gilman St
- 27704 Maplewood St
- 7017 Fairwood Dr
- 7051 Fairwood Dr
- 7018 Fairwood Dr
- 6995 Fairwood Dr
- 6996 Fairwood Dr
- 6980 Fairwood Dr
- 6966 Fairwood Dr
- 27209 W Warren St
- 7209 Fairwood Dr
- 7208 Fairwood Dr
- 7208 Hillside Dr
- 6941 Fairwood Dr
- 27283 W Warren St
- 27021 E Pleasant Ridge St
- 6948 Fairwood Dr
- 7223 Fairwood Dr
- 7222 Fairwood Dr
- 7222 Hillside Dr
- 7209 Hillside Dr
- 27027 E Pleasant Ridge St